Appearance
Quick Start
Your First Scan
BrowserStack Code Quality is an AI-powered software analytics platform that enables teams to analyze source code for design issues, bugs, metrics violations, and duplication to ensure long-term maintainability.
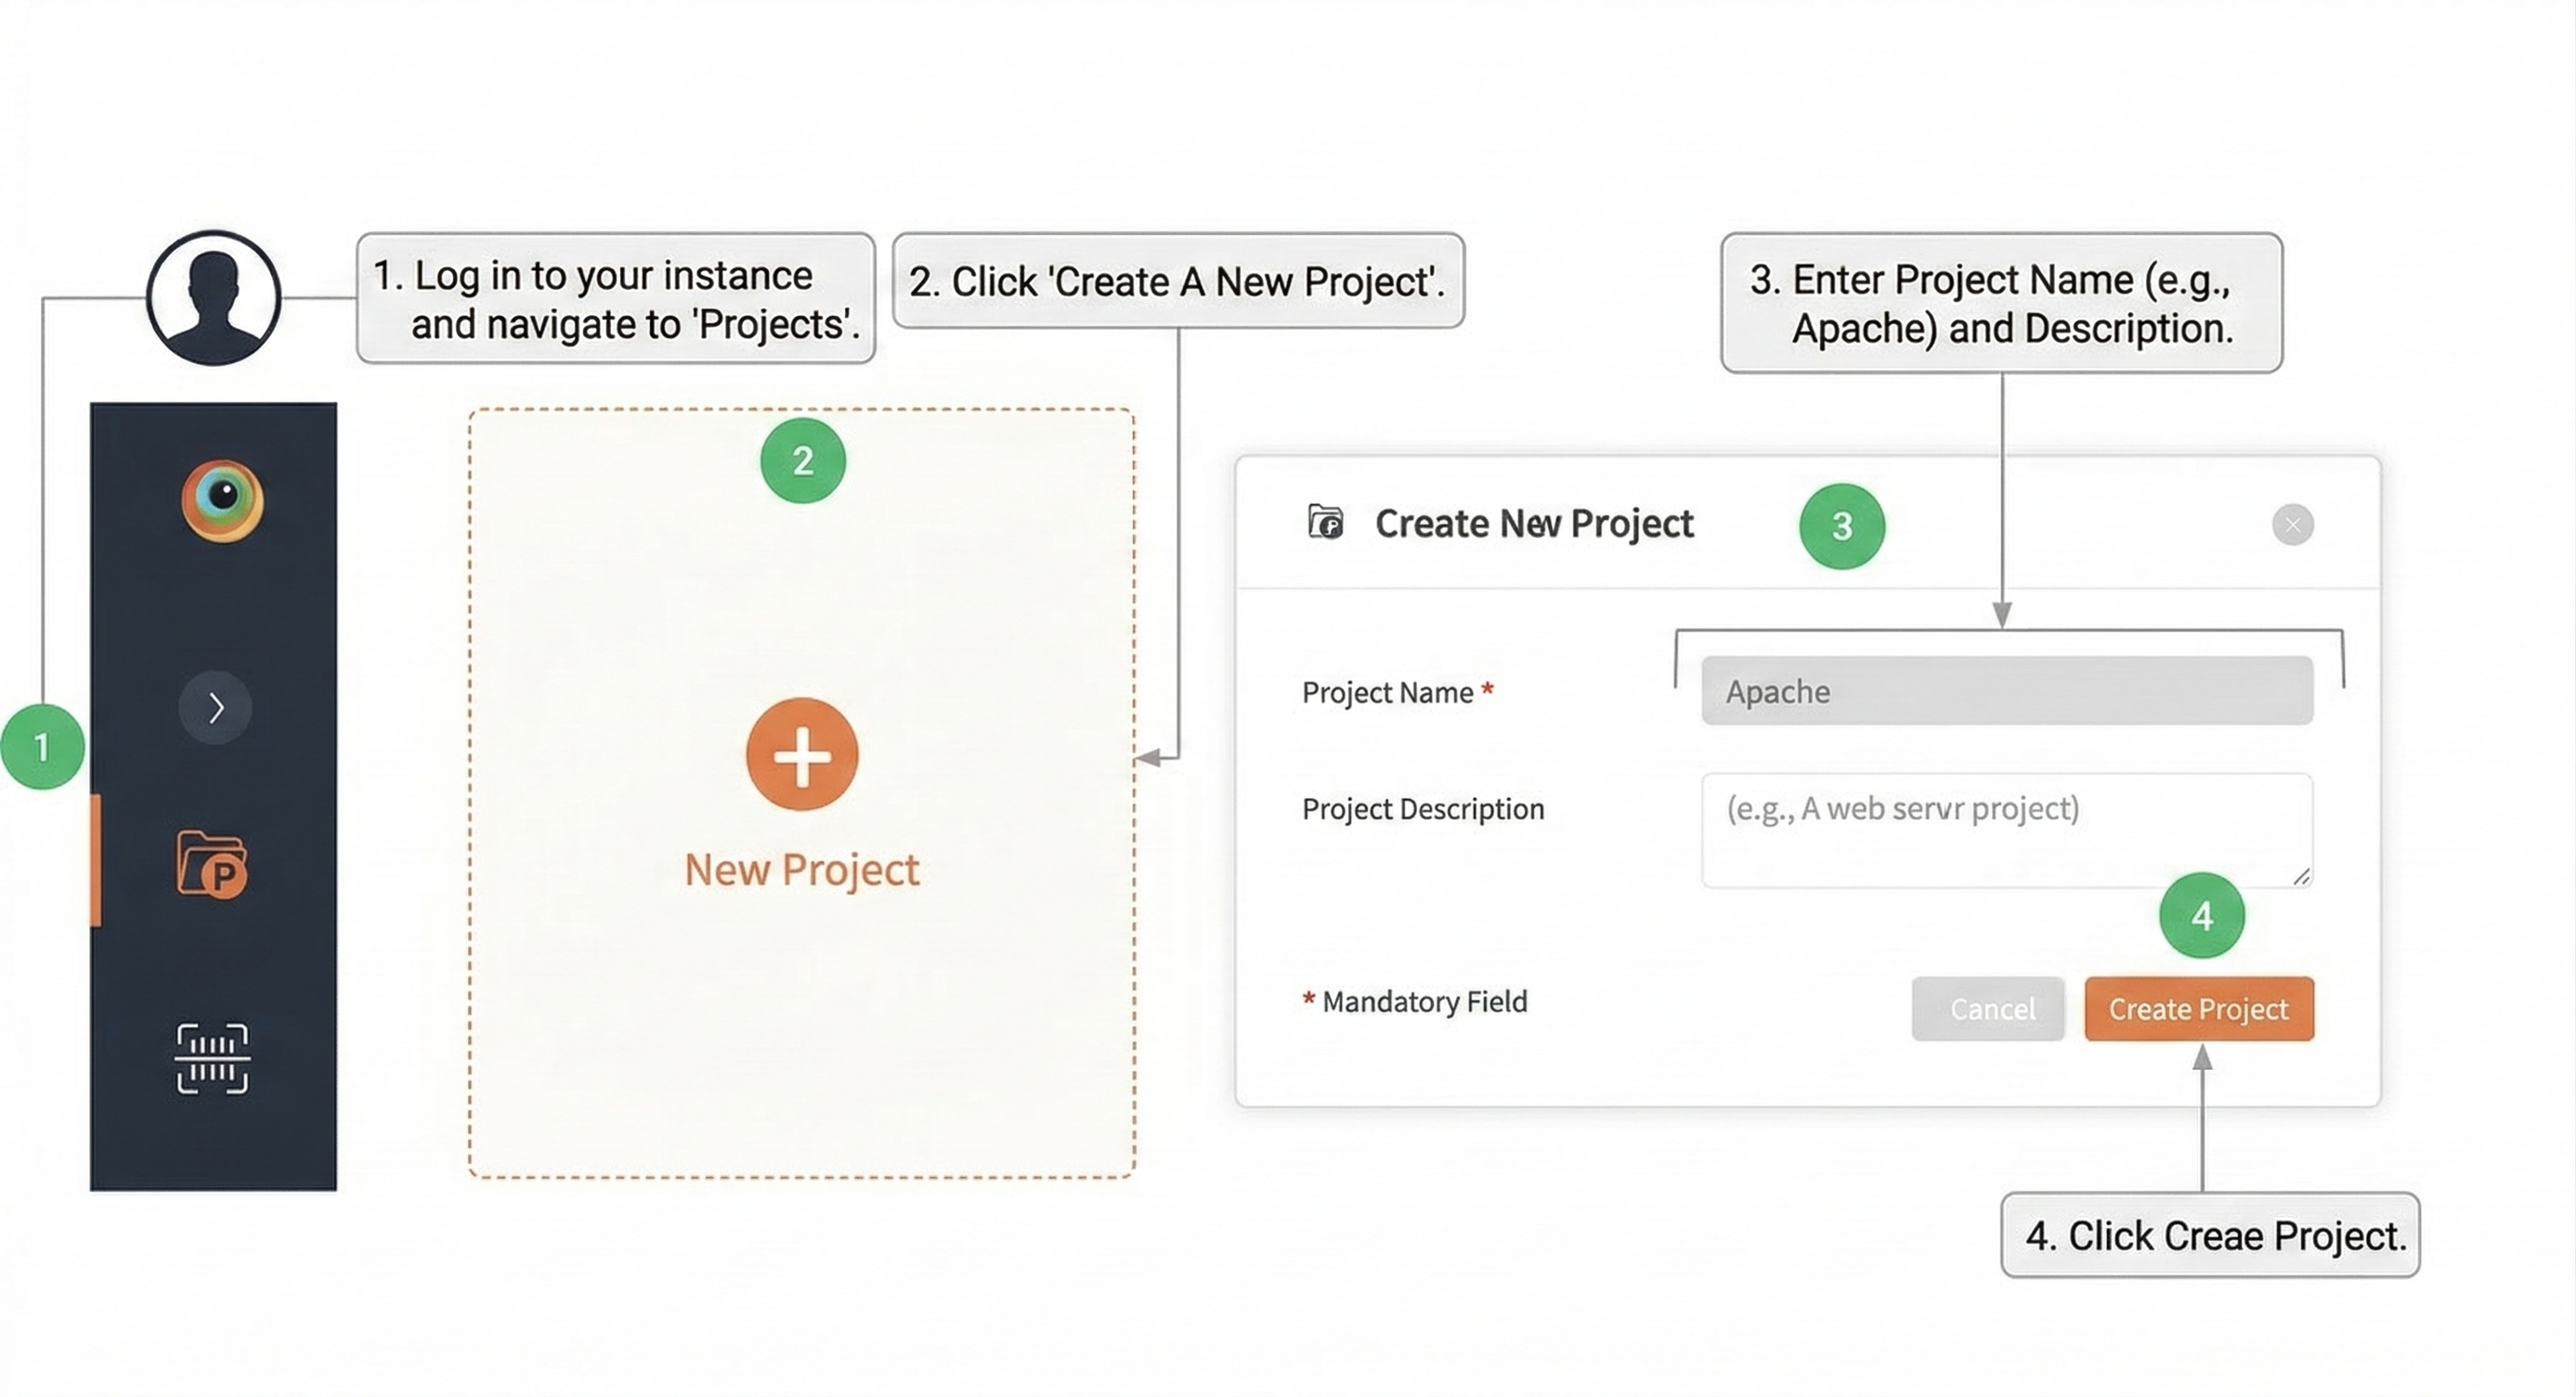
1. Creating a Project
- Log in to your instance.
- Go to Projects and click Create A New Project.
- Enter the Project Name (e.g.,
Apache) and Project Description. - Click Create Project.
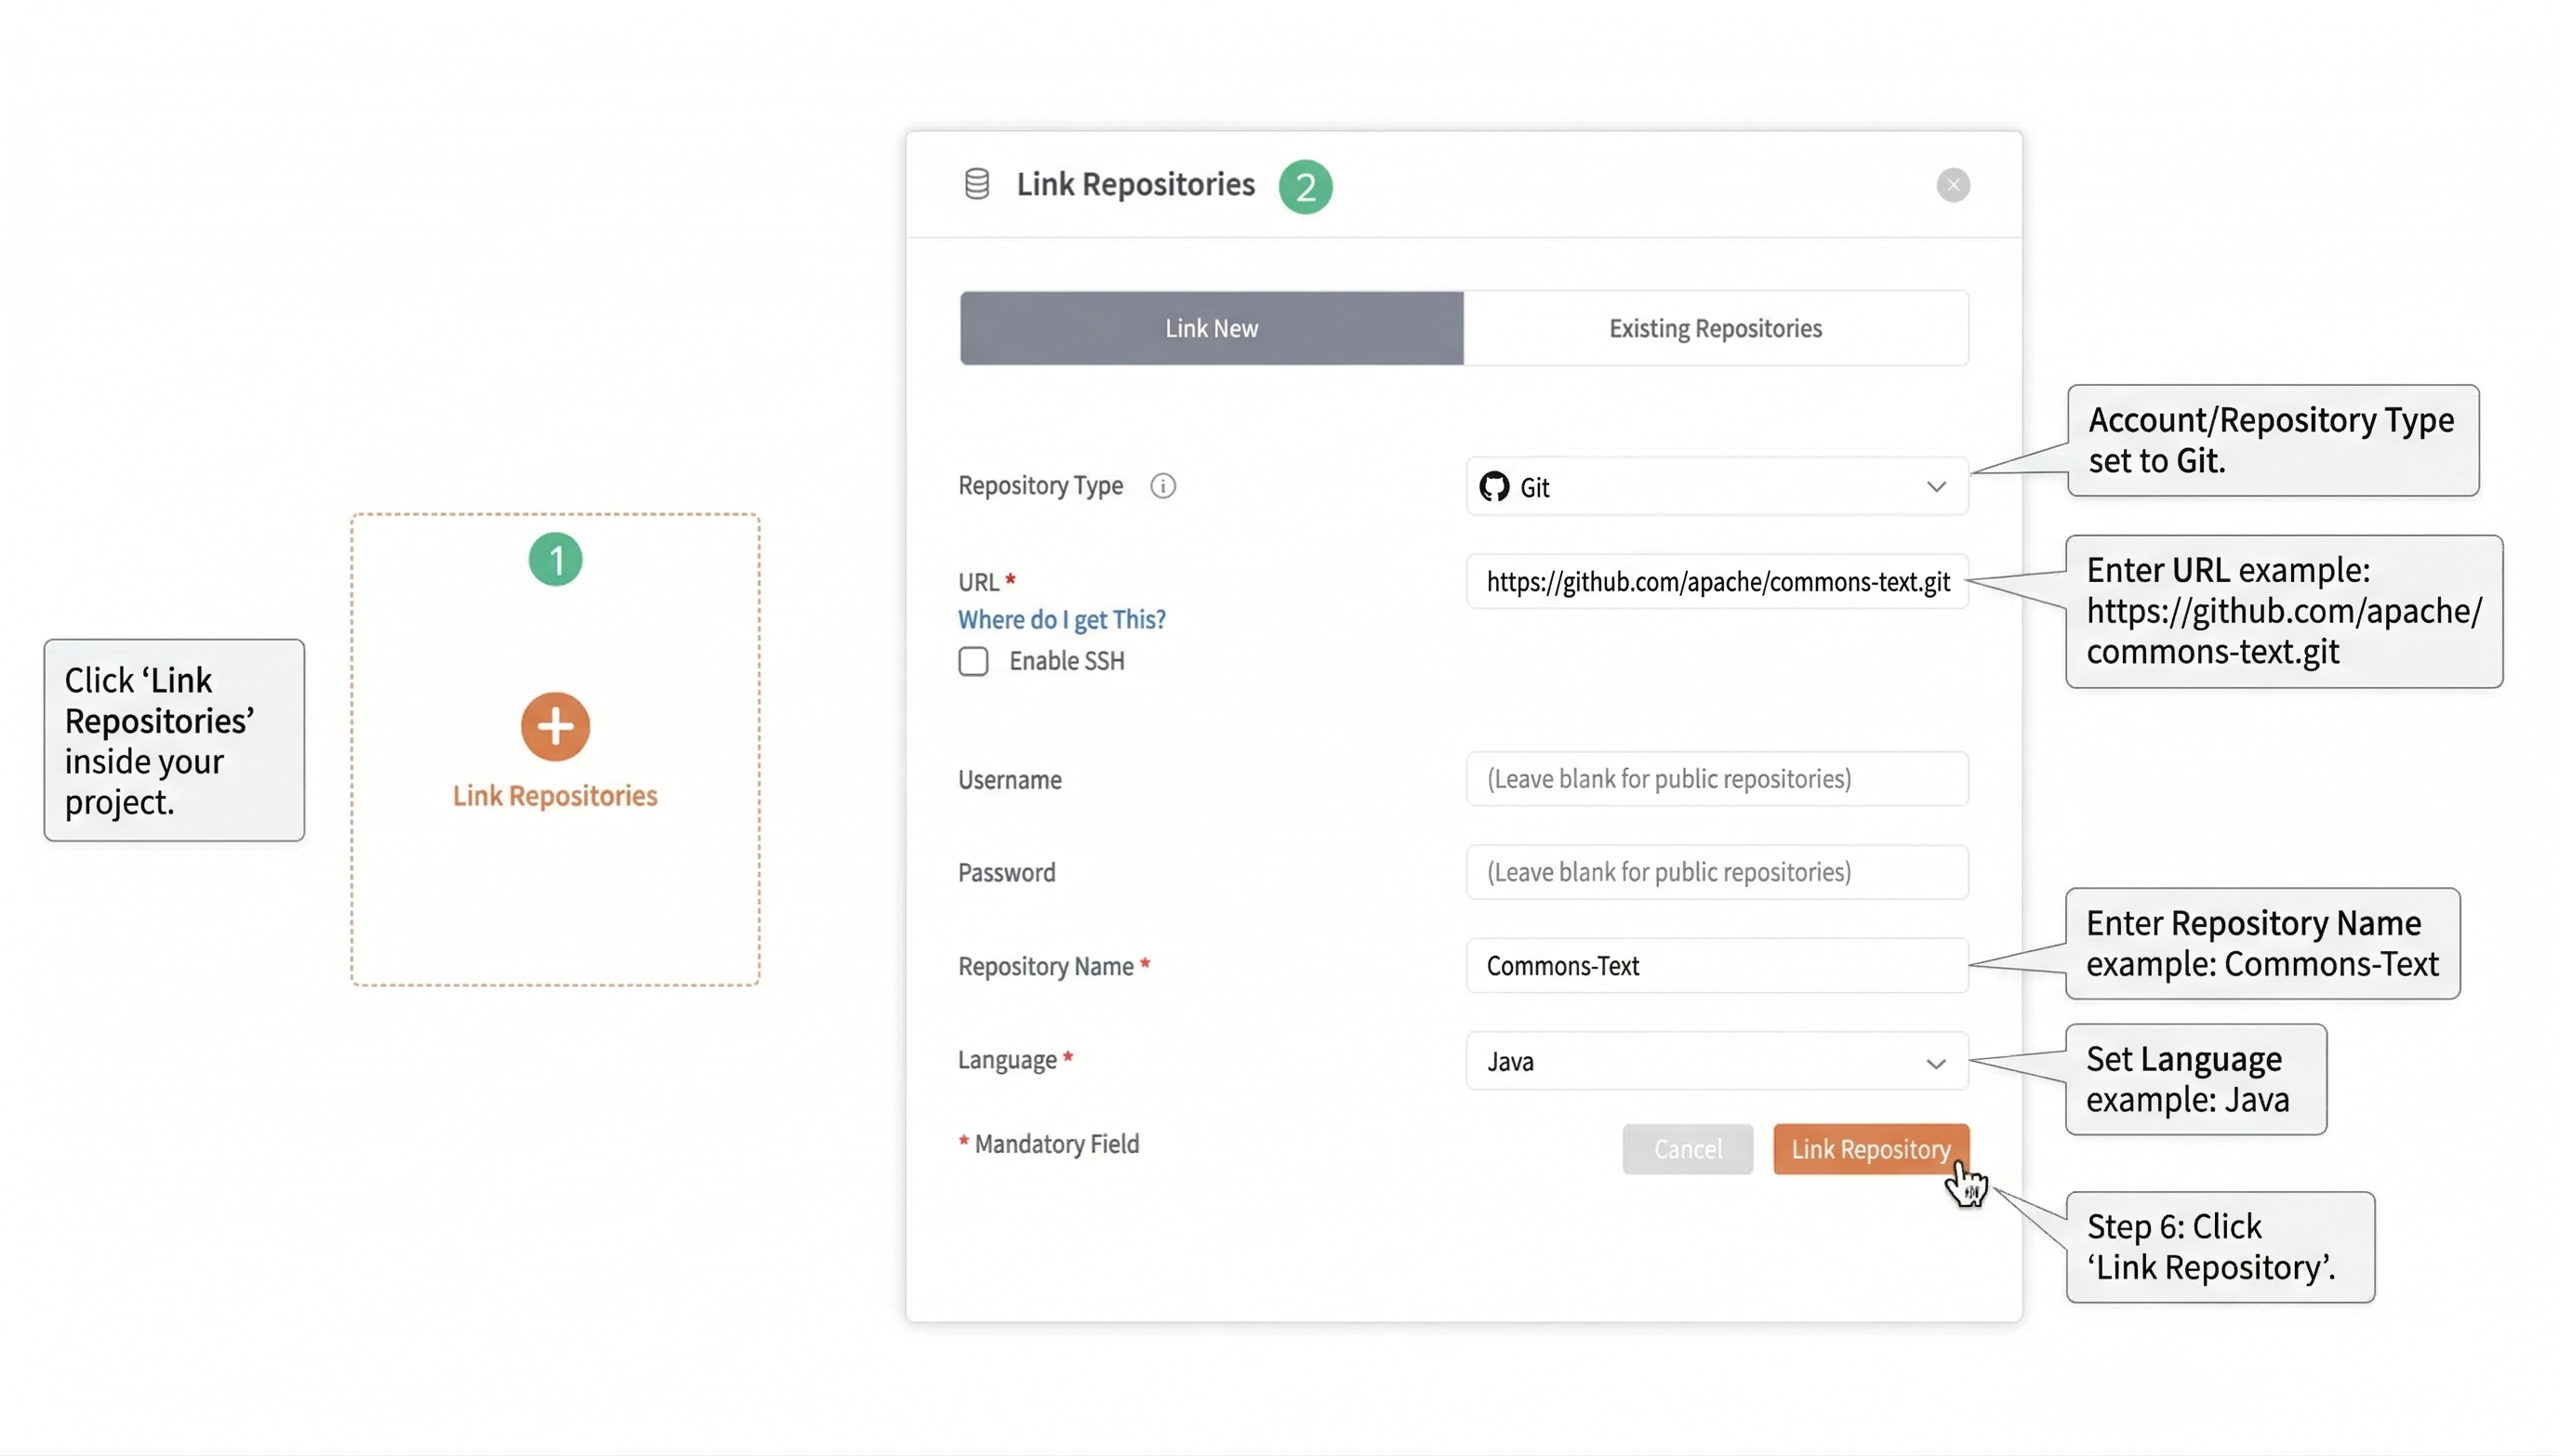
2. Linking a Repository
- Click Link Repositories inside your project.
- Set Account/Repository Type to
Git. - Enter the URL (e.g.,
https://github.com/apache/commons-text.git). - For public repositories, leave the Username and Password blank.
- Enter the Repository Name (e.g.,
Commons-Text). - Set Language (e.g.,
Java) and click Link Repository.
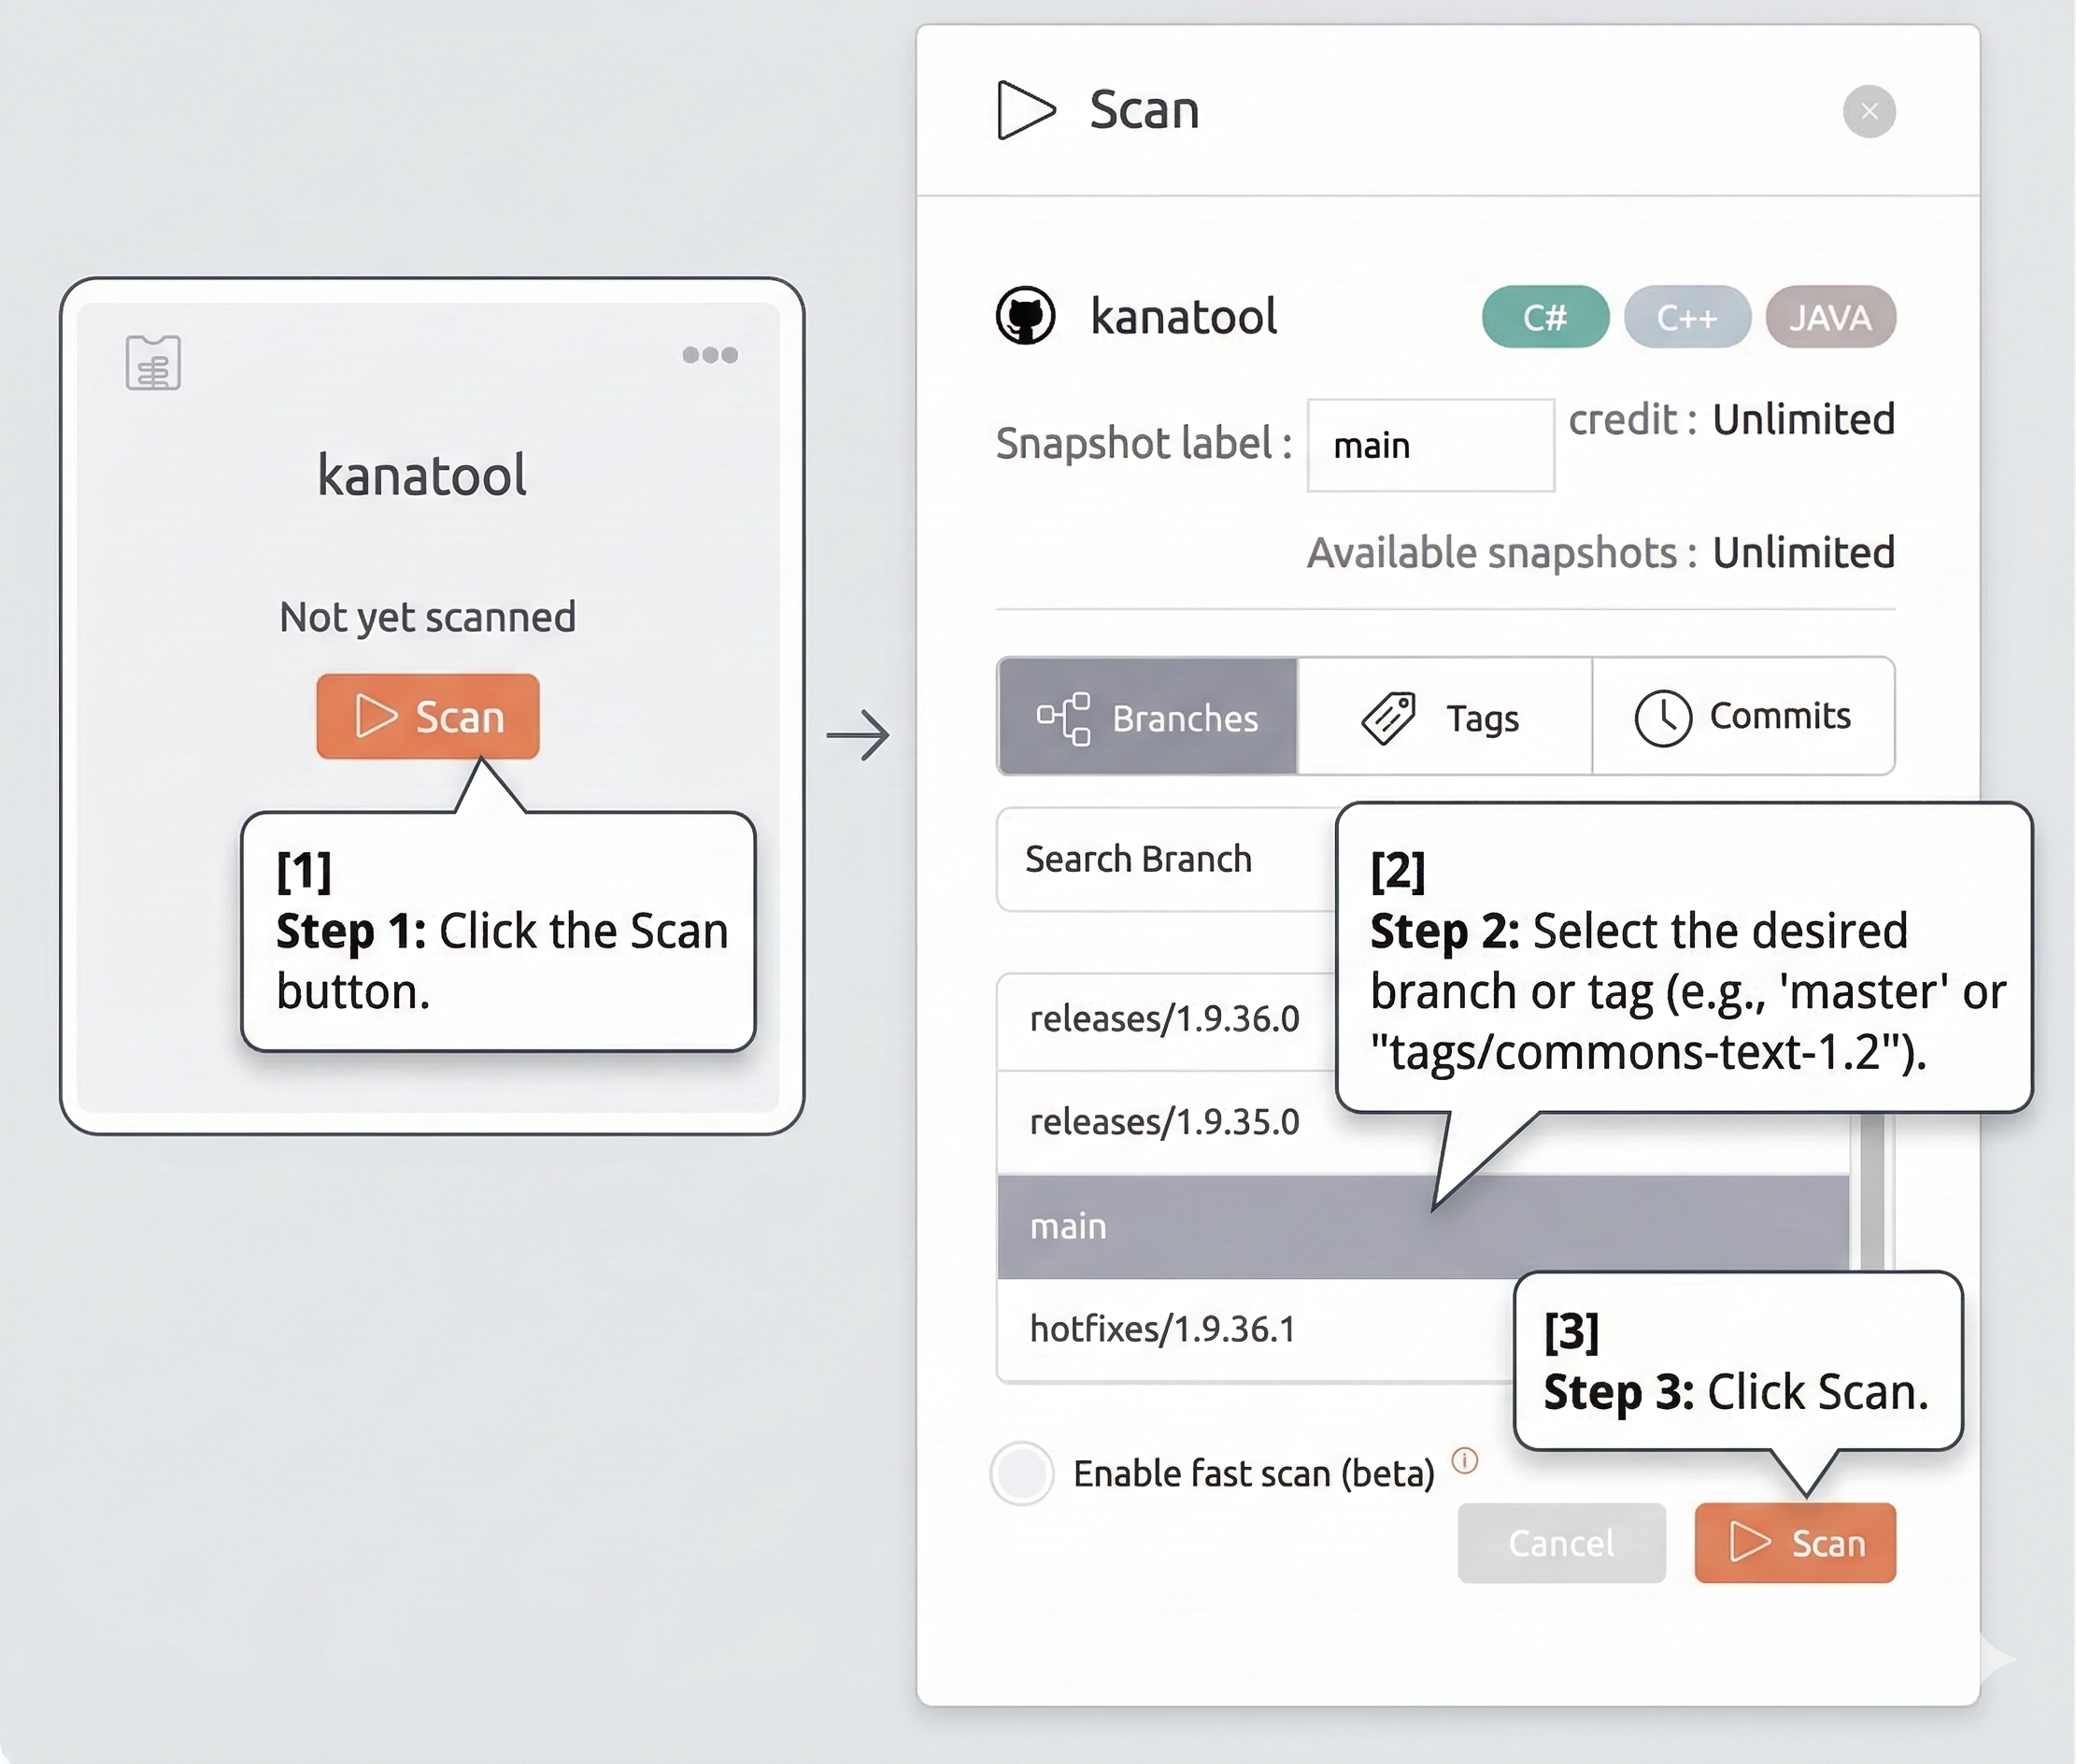
3. Running a Scan
- Click the Scan button.
- Select the desired branch or tag (e.g.,
masterortags/commons-text-1.2). - Click Scan.
- Monitor the status in the Scan Queue via the left menu. The scan is complete when status reaches
Completed.
Identifying Problems
BrowserStack Code Quality uses a rating system from -5 to 5. The Repository Dashboard shows the overall rating and sub-ratings for Design, Metrics, Duplication, and Code Issues.
Get an Overview of Your Software
The Repository Dashboard displays the comprehensive quality metrics for your codebase. Access the main dashboard after a scan completes to view ratings, trends, and key statistics.
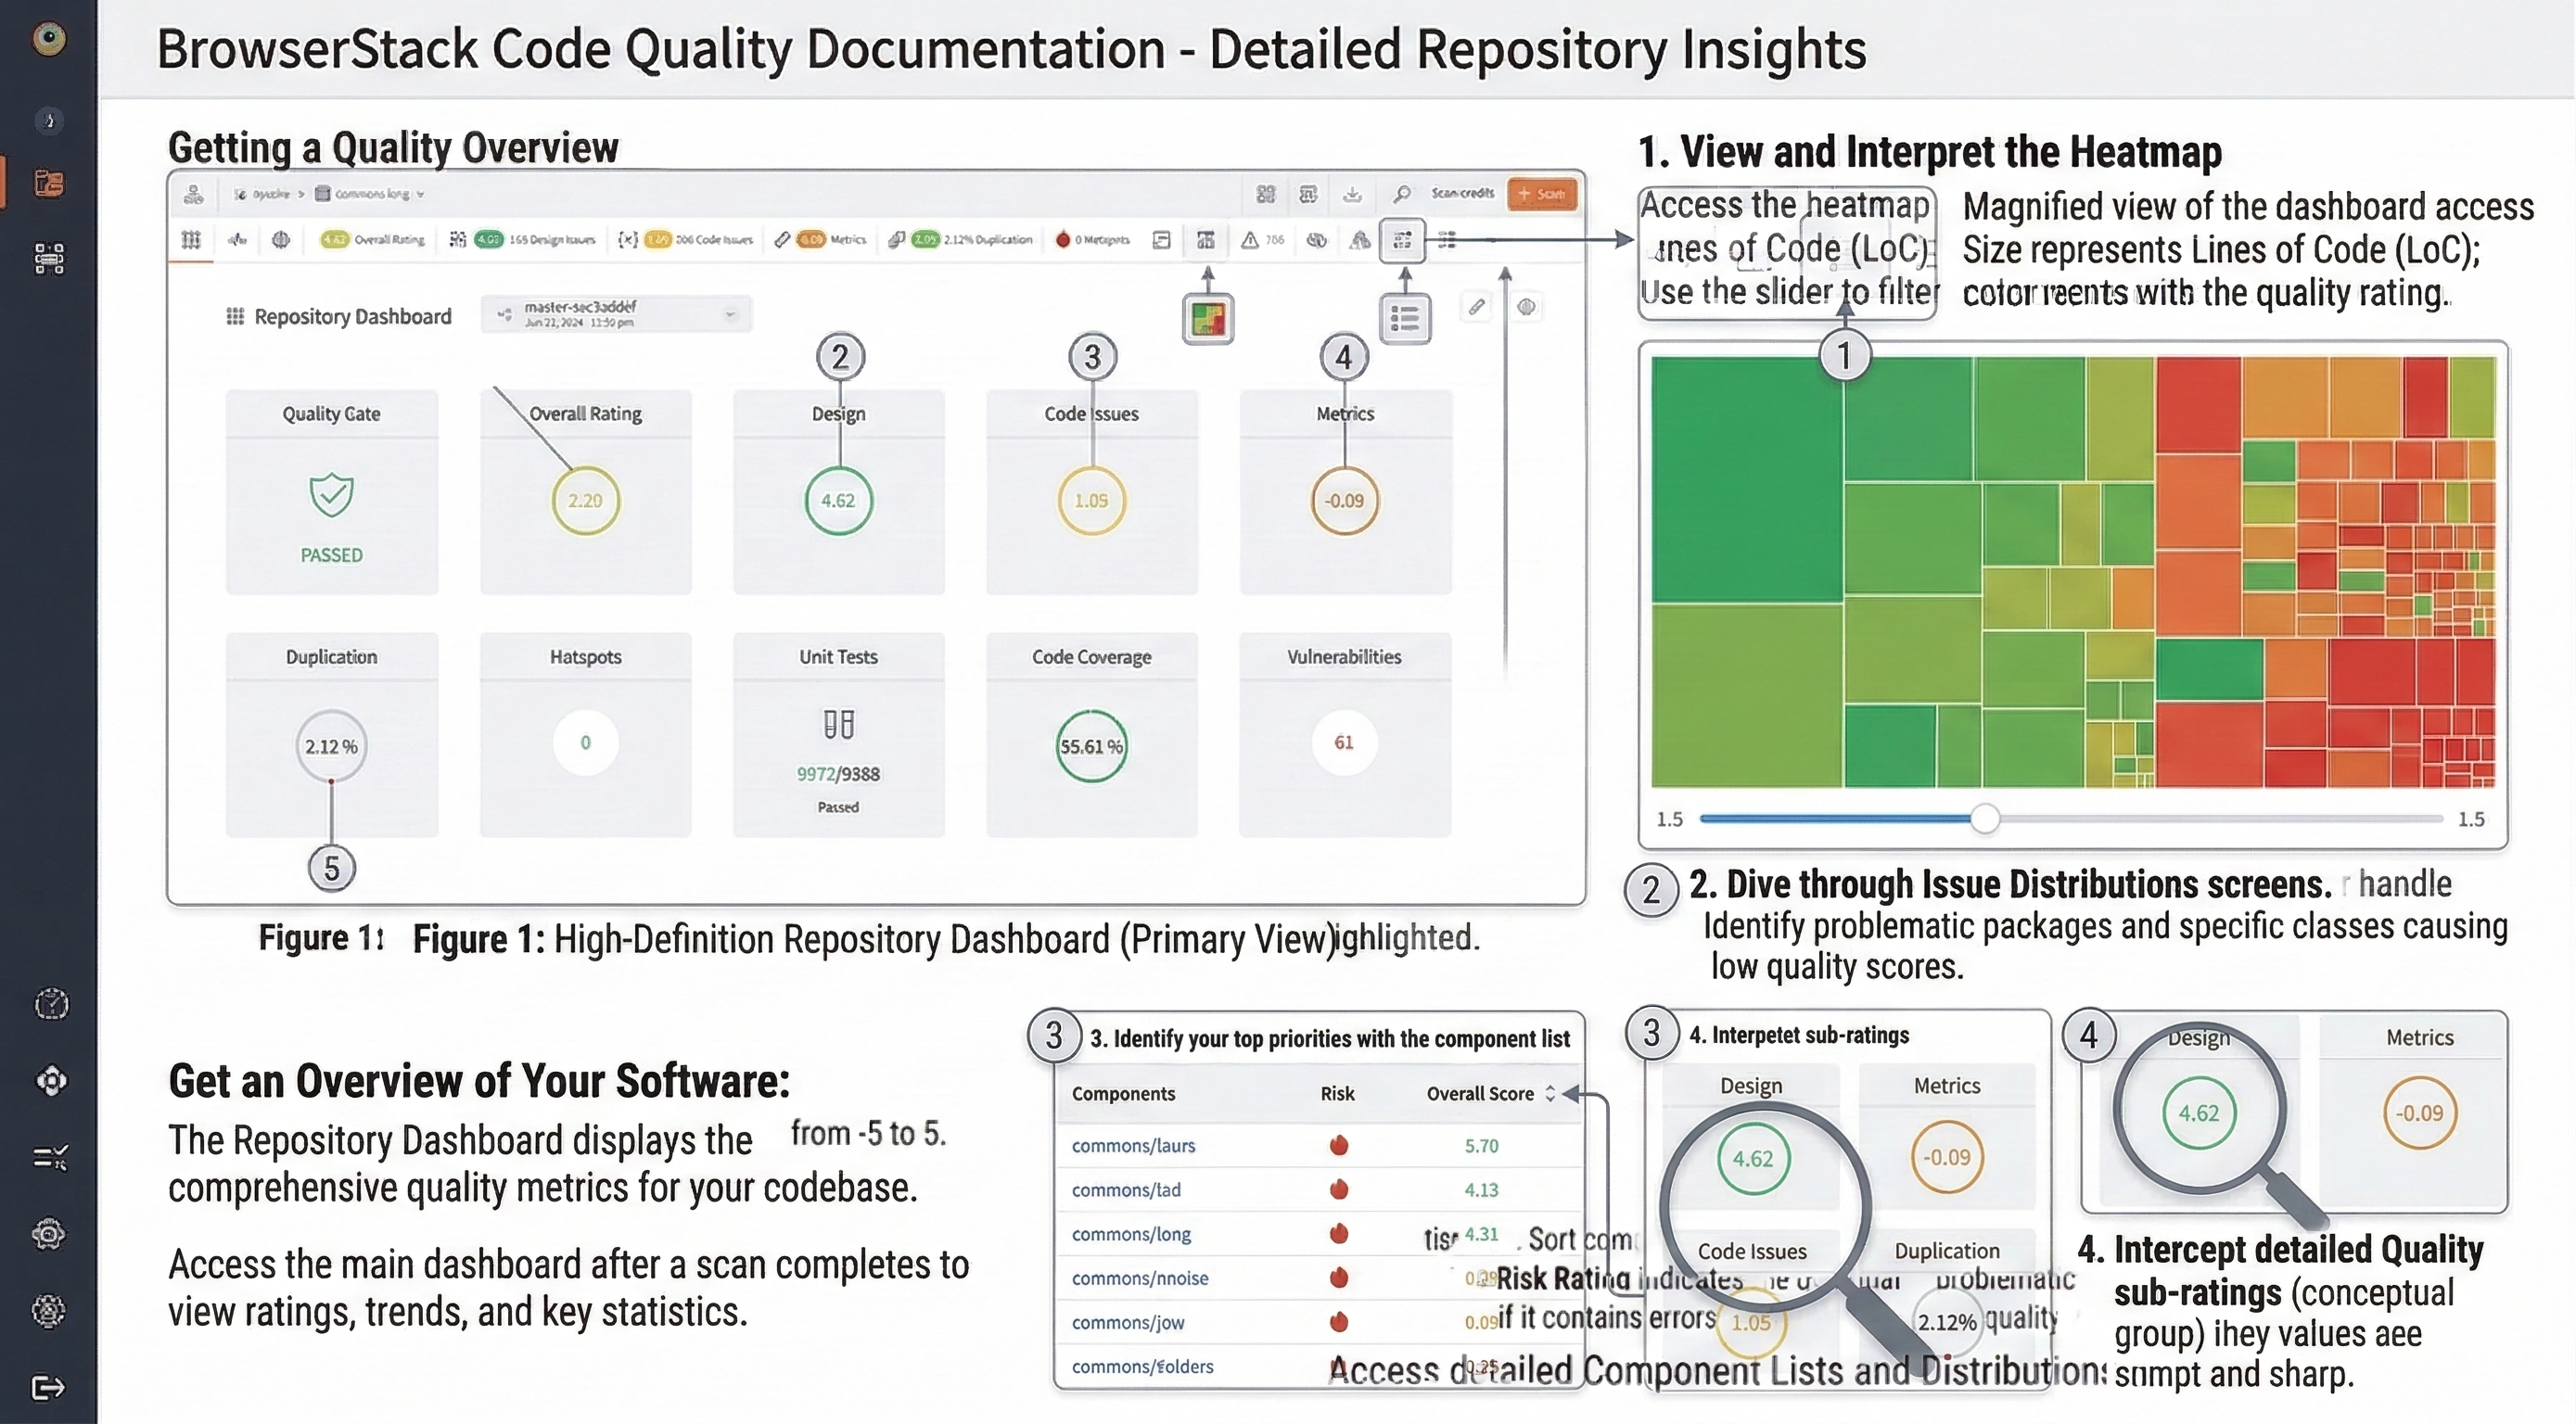
View and Interpret the Heatmap
Access the heatmap via the box icon. Size represents Lines of Code (LoC); color represents the quality rating. Use the slider to filter components with ratings below 1.5.
Identify your top priorities with the component list
Access the component list via the list icon. Sort components by Overall Score to identify the lowest quality files. The Risk Rating indicates the potential impact of a component on the software if it contains errors.
Dive through Issue Distributions
Use the distribution screens in the top bar to identify problematic packages and specific classes causing low quality scores.
Improving Hotspot
Using the component explorer to fix issues
Click on a component to view the exact lines of code where issues reside. The component explorer provides detailed context for addressing identified problems.
Analyze dependencies
Use the platform to view how components interact and identify tightly coupled code that may require refactoring.
Using the Partitions Algorithm
Use the Partitioning Editor to apply the partitions algorithm for refactoring and improving software design.
Assessing Changes
View the impact of change
Compare two snapshots (e.g., version 1.2 vs 1.3). The Change Overview screen shows executable lines added, score changes, and improvements or deteriorations in hotspots.
Dig down to detailed changes
Use the Changed Component List to see specific file-level score changes (indicated by green or red numbers) between snapshots.