Scans
Scanning is the process of analysing a repository to detect various issues in it. A scan can be performed on a tag, branch or commit. When a branch is selected, latest available code on the branch will be scanned. A scan results in a snapshot. A snapshot is the representation of the state of a repository in a specific point in time.
Number of scans you can perform is determined by your BrowserStack Code Quality license.
Scan a repository
Step to scan a repository:
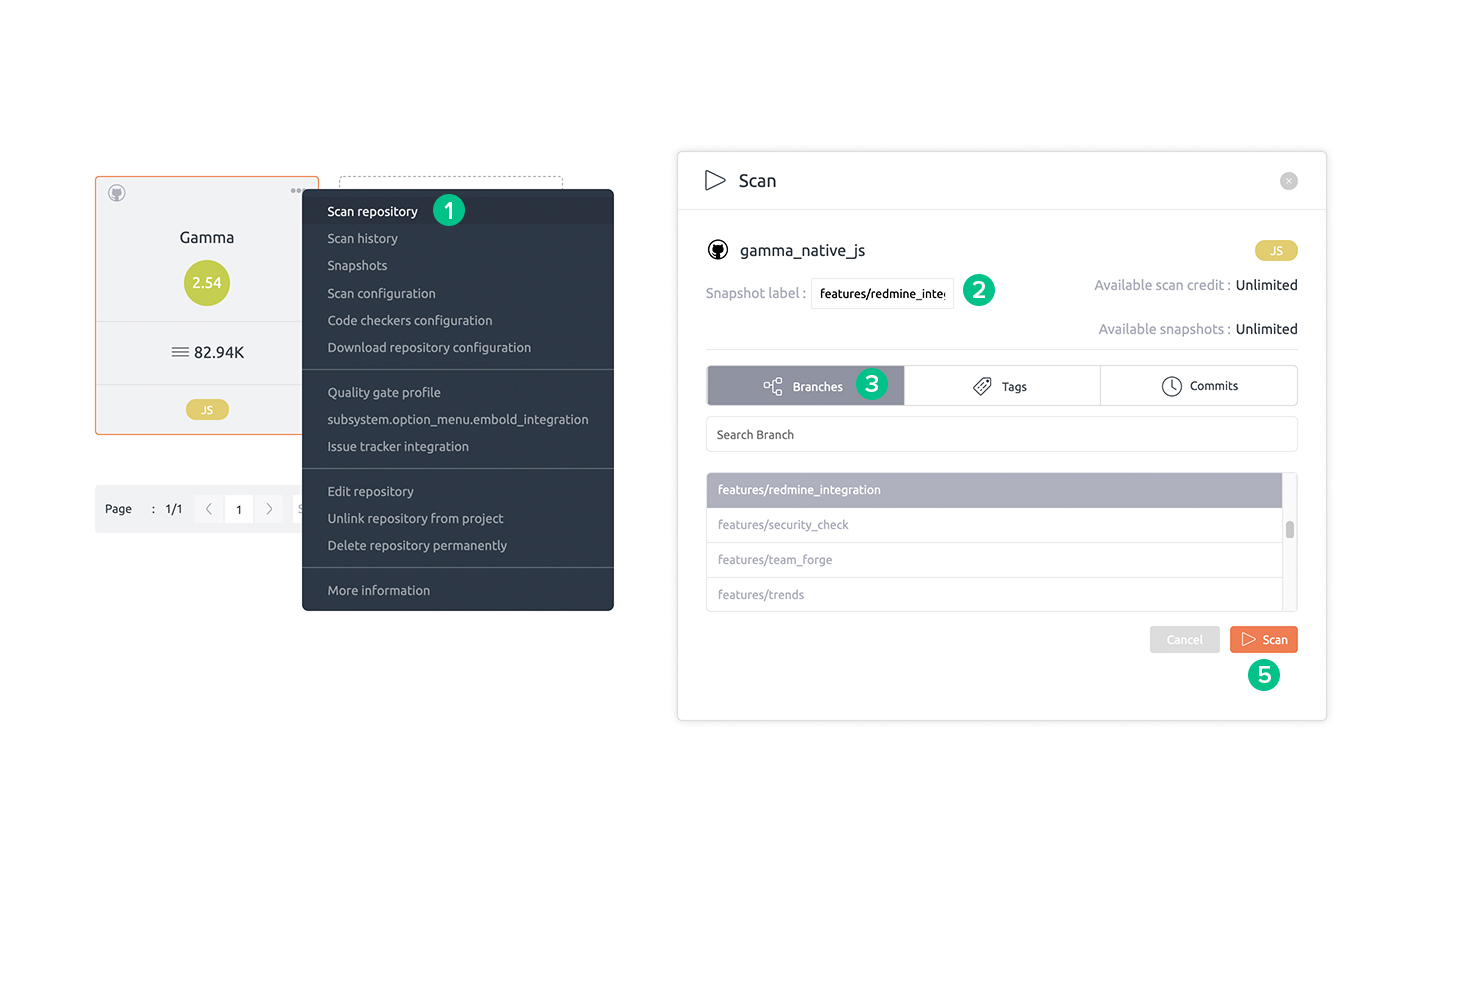
- A scan can be initiated from the repository context menu or from the Scan button on the top bar within a repository.
- In the Scan pop-up, select a snapshot label for future identification.
- Select a tag, branch or commit to scan.
- Check Enable fast scan if you don’t need a complete scan. Read more about fast scan here.
- Click the Scan button to start scanning. To know about monitoring the progress of the scan, read this article.
Monitoring scan progress
Steps to monitor the progress of a scan:
- Navigate to Scan Queue page from left hand side navigation bar.
- You can see a list of all ongoing scans here. Basic information and scan progress can be viewed here. An ongoing scan can be aborted using Abort button.
- To get a detailed log of the scan, click any ongoing scan from the queue.
- Scan details view will allow for detailed monitoring of scan progress. Log of completed or failed scan can be accessed using scan history feature. Scan can be aborted by clicking Abort Scan button from this page.

Aborting or stopping an ongoing scan
Steps to abort or stop a scan:
- Navigate inside a repository being scanned.
- Click the the Abort Scan button on top bar to abort the scan.
- Alternatively an ongoing scan be aborted from the scan queue page or scan details page.
Scan History
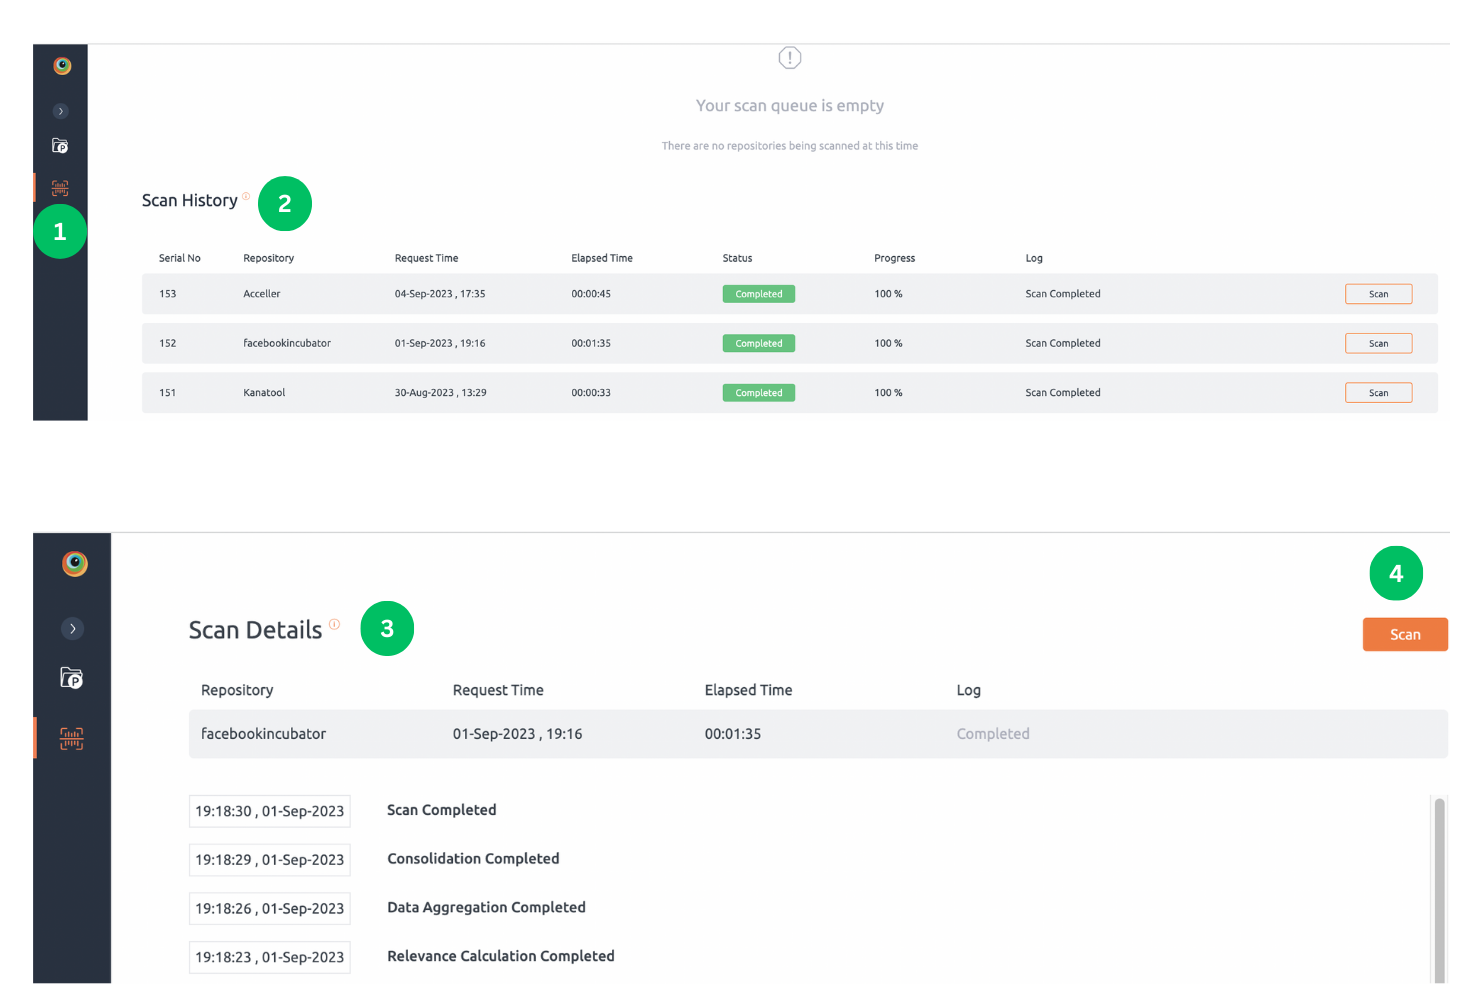
Scan history allows you to investigate scans executed in the past. For each scans that is successful, failed or aborted, a detailed log is available. You can view scan history of a repository through the “Scan History” option in the repository context menu.
You can find recently concluded scans including failed scans here.
Steps to view recent scans :
- Navigate to Scan Queue page from left hand side navigation bar.
- You can see a list of all recently concluded scans here. To scan repository again click Scan button.
- To get a detailed log of the scan, click any scan from the Scan History list.
- Detail log can be displayed on Scan Details view, click Scan button to scan repository again.
Scan configurations
The scan configuration helps you to fine-tune the scan by excluding parts of your code from the scan, uploading additional included directories or adding parser options.
Scan Configuration pop-up can be opened from the repository context menu.
The scan configuration pop-up is displayed. Fill the information in different fields.
The scan configuration fields are described below:
Excludes
You can exclude specific source files by providing JavaScript formatted regular expressions.
Examples:
| Example | Code |
|---|---|
| Filter out files containing the keyword “test” | “.*test.*” |
| Filter out everything but one file | “^(?!.*parse-this-file-only.cpp*$).*” |
| Using escape characters to match special characters (+,.) | “.*test.c++*” |
Default Exclusions
| Language | Regular expression | Description |
|---|---|---|
| Java | (?i)(test|generated|mock|thirdparty|third-party|3rd-party|3rdparty|external) | Any file path containing 'test', 'generated', 'mock', 'thirdparty', 'third-party', '3rd-party', '3rdparty' and 'external' would be excluded. |
| C/C++ | thirdparty;third-party;3rd-party;external;generated;mock;test;build | Any file path containing 'thirdparty', 'third-party', '3rd-party', 'external', 'generated', 'mock', 'test' and 'build' would be excluded. |
| C# | (?i)(.g.cs|example|mock|assemblyinfo.cs|.AssemblyAttributes.cs|.AnyCPU.Debug|.AnyCPU.Release) | Any file path containing '.g.cs', 'example', 'mock', 'assemblyinfo.cs', '.AssemblyAttributes.cs', '.AnyCPU.Debug' and '.AnyCPU.Release' would be excluded. |
| Objective-C | thirdparty;third-party;3rd-party;external;generated;mock;test;build | Any file path containing 'thirdparty', 'third-party', '3rd-party', 'external', 'generated', 'mock', 'test' and 'build' would be excluded. |
| Python | _init_.py;test | Any file path containing '_init_.py' and 'test' would be excluded. |
| JavaScript | node_modules;.min.js;dist;external;assets;gulp;grunt;libs;-bundle.js;.bundle.js;swagger-ui;.config.js;-config.js;UNKNOWN_FILE;.git;.ebextensions;test;.lib;.library;.zip | Any file path containing 'node_modules', '.min.js', 'dist', 'external', 'assets', 'gulp', 'grunt', 'libs', '-bundle.js', '.bundle.js', 'swagger-ui', '.config.js', '-config.js', 'UNKNOWN_FILE', '.git', '.ebextensions', 'test', '.lib', '.library' and '.zip' would be excluded. |
| TypeScript | node_modules;.min.js;dist;external;assets;gulp;grunt;libs;-bundle.js;.bundle.js;swagger-ui;.config.js;-config.js;UNKNOWN_FILE;.git;.ebextensions;test;.lib;.library;.zip;.d.ts | Any file path containing 'node_modules', '.min.js', 'dist', 'external', 'assets', 'gulp', 'grunt', 'libs', '-bundle.js', '.bundle.js', 'swagger-ui', '.config.js', '-config.js', 'UNKNOWN_FILE', ' .git', '.ebextensions', 'test', '.lib', '.library', '.zip' and '.d.ts' would be excluded. |
| PHP | vendor;wp-content/plugins;protected/extensions;test | Any file path containing 'vendor', 'wp-content', 'plugins', 'protected', 'extensions' and 'test' would be excluded. |
| Go | test | Any file path containing 'test' would be excluded. |
| Kotlin | test | Any file path containing 'test' would be excluded. |
| Solidity | test | Any file path containing 'test' would be excluded. |
| SQL | test | Any file path containing 'test' would be excluded. |
Parser Options
Currently, parser o
Parsing invalid code:
By default, invalid code parsing is enabled but it can be disabled using the following option:
–parse-invalid-code=OFF
Note: Support for invalid code parsing is limited and may result in parser failure. In case this happens, please disable invalid code parsing.
Define Macros:
Macros can be defined with GCC like option format.
Example:To define macro MY_MACRO -> –clang=”-DMY_MACRO=”
Any option to compiler can be given with –clang=
Recursive include header search:
By default, the parser searches for any header file recursively in all the sub-directories of the source folder. This can lead to incorrect results if there are multiple header files with the same name but in different folders.
To disable searching in all sub-directories use the following option:
–include-all=OFF
Uploading Includes
This option is only relevant for scanning C or C++ repositories. If an included file is not found in the source directory, the C/C++ parser will throw a warning message which contains the location of the missing include.
The accuracy of the parser can be improved by uploading the directories which contain the missing files with the correct path. Includes can be uploaded in .zip format.
Note: Source code from additional include directories will not be considered for analysis. It is only used to resolve header dependencies (type resolution).
Custom extensions for C & C++
This section covers how BrowserStack Code Quality supports custom extensions for C and C++ languages.
UI Scan
On UI, custom extensions can be specified with Additional Options field of scan configuration page as shown below:
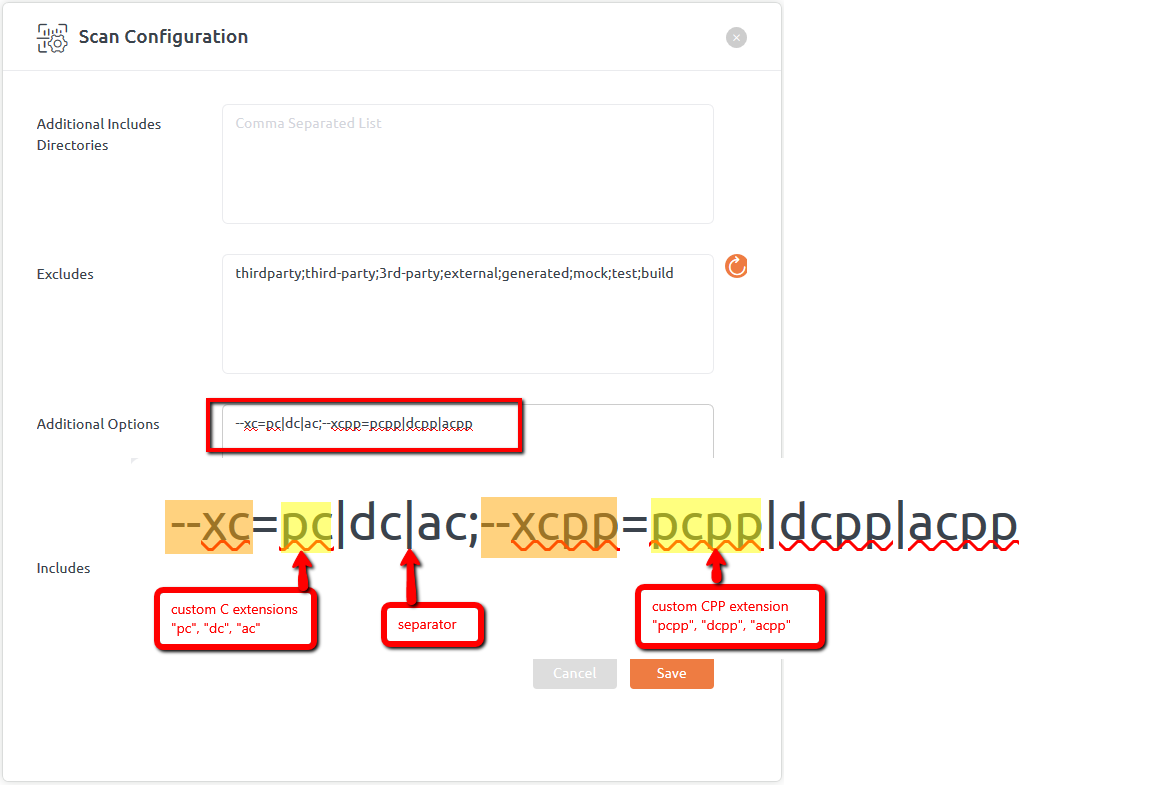
The flag for supplying C extension is “--xc“ and for CPP is “--xcpp“.
User can provide multiple C/CPP extensions with the help of pipe (|) separator as shown above.
And multiple options can be provided using semicolon (;) separator.
Remote Scan
Custom extensions can be specified in remote scan mode also by updating additionalOptions field of gammascan.json file as shown below:
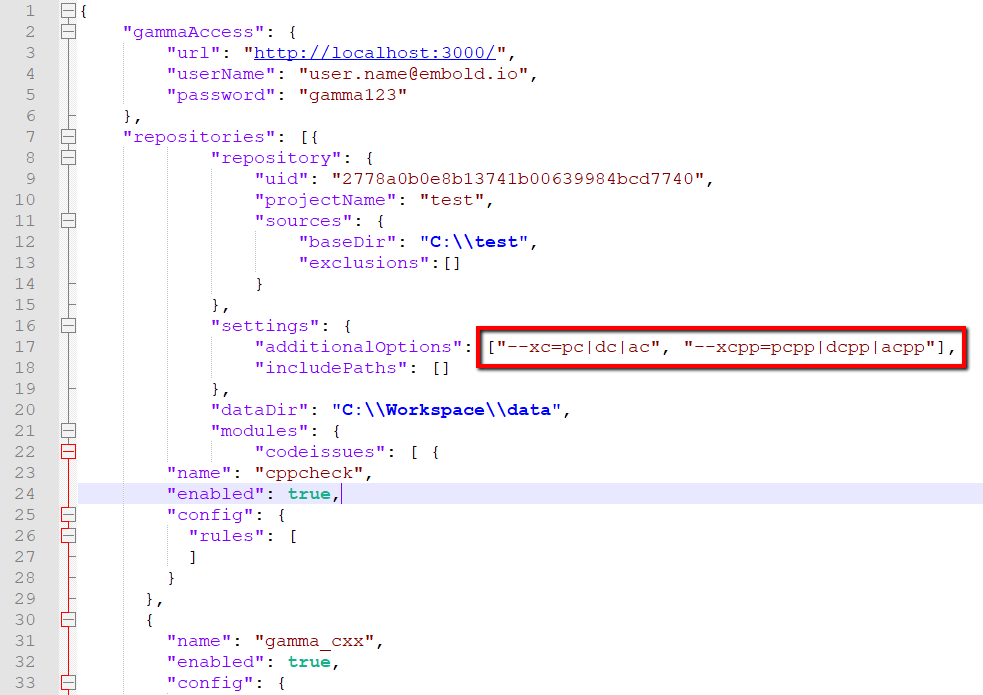
In gammascan.json, multiple options are specified using comma (,) separator.
With these additional options, all the files in repository ending with .pc or .pcc will be considered as C and C++ files respectively, and parsed accordingly.
Overwrite default scan configuration
This section helps to understand how you can overwrite your scan configuration using a checked in file.
Default Configuration Settings
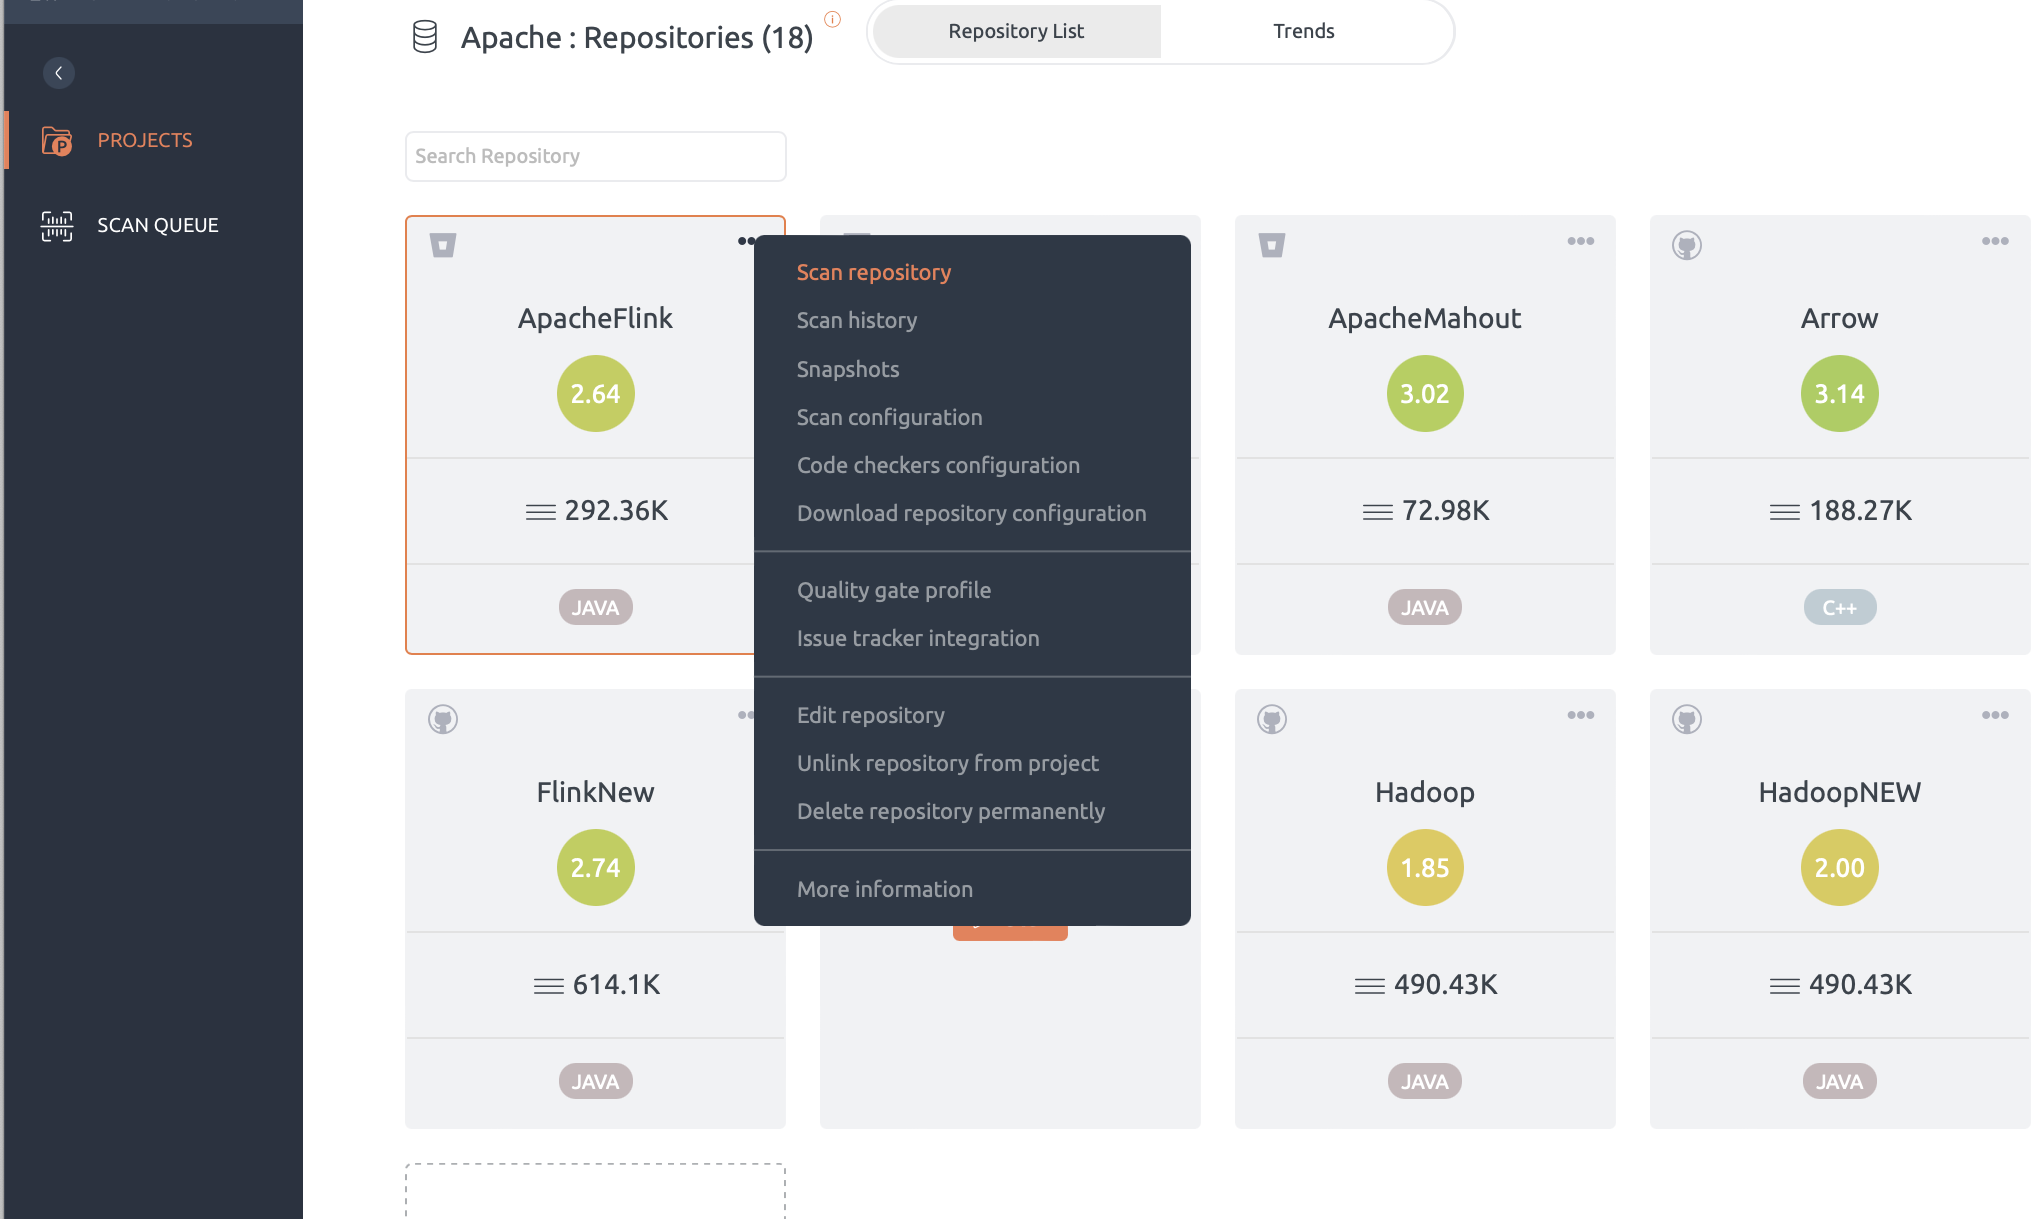
You can download default configuration settings from:
- Go to Projects
- Click on project where the repository belongs
- Click on the 3 dots at the top of the repository
- Click on Download repository configuration
Update configuration settings using embold.json
To update the configuration settings,
- You can use the downloaded repository configuration file (as shown in the previous section) as a template.
- Make your desired changes and save the file as embold.json.
- Commit this embold.json file to the base/root directory before scanning.
Update scan configurations from UI
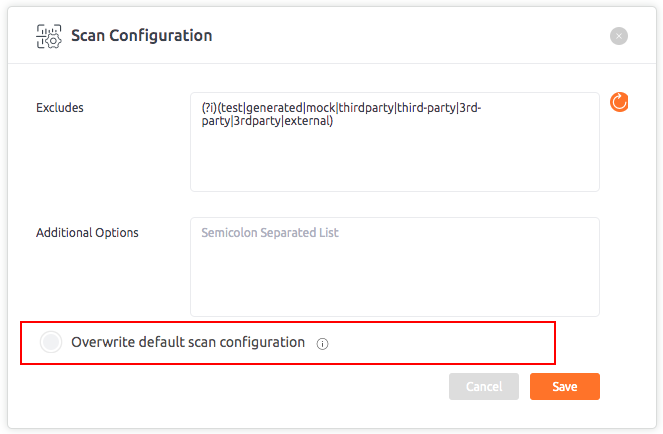
- Go to “Scan configurations” from the repository settings and select “Overwrite default scan configuration” checkbox. By default, this checkbox is unticked.
- But, if the user modifies any parameter in UI such as excludes or Additional Options or anything from code checkers, tick the checkbox “Overwrite default scan configuration“.
- The original parameters will be overridden.
We cannot overwrite changes for remote repositories.
BrowserStack Code Quality Scan Configuration JSON
This section mentions how the data is stored in JSON (JavaScript Object Notation) and it can be customized by adding our own JSON objects.
Code Quality JSON structure
This section helps you to understand different field types, its description, its importance, and default values that areused in the JSON file.
| Field Type | Usage | Type | Default |
|---|---|---|---|
| GammaAccess | This is the name of code quality project. | ||
| URL | Specifies URL of the website | String | Empty |
| Username | Stores user name for basic authentication to connect to the remote machine | String | Empty |
| Password | Stores password for basic authentication to connect to the remote machine. User can access either using username-password or by adding token for authentication. | String | Empty |
| Token | Stores token for basic authentication to connect to the remote machine. User can access either using username-password or by adding token for authentication. | String | Empty |
| Repositories | Specifies the repository information that will be scanned during your analysis process. For more information, refer this article | ||
| DataDir | This is used to store the temporary files. | String | Empty |
| UId | Stores repository uid which is unique for each repository | String | Saved from UI |
| Projectname | Specifies the repository name | Saved from UI | |
| Sources | Path/directories/files that can be scanned during your analysis process. For more information, see as | ||
| BaseDir | This is a base directory where source code resists. Moreover, this is a kind of main directory where all the operations such as cloning, scans, etc is performed. | String | Empty |
| Exclusions | Specifies list of files/directories/languages that needs to be excluded from your analysis. | Array | Empty |
| Settings | Specifies some additional options that can be used for scan configuration scanning process. | ||
| AdditionalOptions | Specifies the list or lists of additional options that needs to be scanned. | Array | Empty |
| IncludePaths | Specifies the file or list of files that needs to be scanned. | Array | Empty |
| Modules | Modules can be used for scanning process. For more information, refer this article . | ||
| CodeIssues | This is a type of the module. This section is used to enabling/disabling code checker configuration. For more information, refer this article. | ||
| UnitTest | Specifies the input data value. For e.g. the input can be in CSV/XML or any other format. | List | |
| Coverage | Specifies the coverage information across different modules. For more information, refer this link. | List | |
| Relevance | Specifies the name of code issue. | List | |
| Name | Specifies the name that can have multiple values such as codeissues, unittest, coverage or relevance. | List | Saved from UI |
| Enabled | Specifies whether the code checker is enabled or not. | Boolean | Saved from UI |
| Config | Specifies the configuration for that particular code checker | ||
| Rules | Specifies the rules for code issue | Array | |
| options | These include additional options for code checkers like PMD. | ||
| Name | Specify the rule name for different modules. | String | Saved from UI |
| Type | Specifies the type of module. | String | Saved from UI |
| Value | Specifies the value such as integer or string for that particular module. | String | Saved from UI |
| Required | Specifies whether this module should be required while scanning and its value can be true or false. | Boolean | Saved from UI |
Sample JSON file
BrowserStack Code Quality JSON helps you to construct a data hierarchy such as:


Remote scanning
A remote scan is an alternate way to scan with no UI intervention. This can be done using a continuous integration toolchain, or manually via the command line. The results are then published on the UI automatically.
For languages such as C or C++, a strict mode remote scan can help to increase the accuracy of the scan.
Note: The repository type must be set to remote
How to download embold-scanner from Embold?
Download Embold Scanner from this link.
Remote scan using embold-scanner
- Download the Embold CLI tool from the link mentioned above. Extract that Embold CLI tool and make sure it has all the executable permissions.
- Login to Embold server. Now create a Project in Embold. Read more about creating a new project here.
- Generate the Embold Access Token (EAT) for remote scan. Read more here for generating EAT.
- Create and link a remote repository with the language you want to scan. Download the repository configuration (repository-configuration.json) for this new remote repository added.
Click on Link Repositories.

Select Repository Type as Remote.

Give Repository Name and select the language based on what the user wants to scan.

Click on Link Repository.

Commands
embold-scanner– This command is applicable for Linux machines.embold-scanner.bat– This command is applicable for Windows machines.
Sub-commands
- analyse – Scans the local repository and publishes the scan results to the Embold UI.
- local-analyse – Scans the repository locally and store the results in csv without publishing to the Embold UI.
- gated-commit – Use to scan on changes files before the commit is performed.
Usage: embold-scanner analyse -am <arg> -b <arg> -c <arg> -d <arg> -h -l <arg> -r <arg> -s <arg> -sh <arg> -si <arg> -sp <arg> -s <arg> -t <arg> -u <arg> -vd <arg> -rn <arg> -ci <arg> -vd <arg> -sd <arg> -v
Example
- Linux:
embold-scanner analyse -c <./repository configuration.json> -u <Embold URL> -t <Embold TOKEN> -b <BASE_DIR> -d <DATA_DIR> -s <snapshot name> -r <REPO UID> -sh <CORONA PACKAGE PATH> -l <LOG_FOLDER> - Windows :
embold-scanner.bat analyse -c <./repository configuration.json> -u <Embold URL> -t <Embold TOKEN>-b <BASE_DIR> -d <DATA_DIR>-s <snapshot name> -r <REPO UID> -sh <CORONA PACKAGE PATH> -l <LOG_FOLDER>
Options
| -t,–token <arg> | Embold Token |
| -u,–url <arg> | Embold URL |
| -am,–analysis-mode <arg> | Analysis Mode |
| -b,–repository-base-dir <arg> | Scan will happen for this directory |
| -c,–scan-config-file <arg> | Scan settings YAML/JSON file path |
| -d,–data-dir <arg> | Data directory for temporary use |
| -h,–help | Help |
| -l,–scanner-logs <arg> | Embold scanner logs directory path |
| -r,–repository-uid <arg> | The Data will be published in this Repository in Embold UI |
| -s,–snapshot-label <arg> | This label identifies the snapshot which will be published on Embold UI after successful scan. The value can also be an environment variable |
| -sh,–scanner-home <arg> | Embold scanner home path |
| -si,–session-id <arg> | Session ID |
| -sp,–scan-profile <arg> | Scan profile xml file path |
| -ssu, –skip-source-upload | Skip Source Upload |
| -rn,–revision-number <arg> | SCM Revision NUmber |
| -ci,–component-uid <arg> | SCM Component ID |
| -sd,–snapshot-id <arg> | Snapshot id |
| -v,–verbose | Enable verbose mode |
| -vd,–vcs_details <arg> | vcs details |
After a successful remote scan, the below results will be displayed to the user.

Prerequisites
- If you are using CI/CD for C# remote scans, you need to install the DotNet-3.0.101 package if it is not already installed and then simply restart the machine.

- File path use for -sh(scanner home), -l (scanner-logs) and -d(data directory) should have read write permission.
- The following linters/tools must be installed on the remote machine.
| Language | Linter | version |
| CPP | cppcheck | 2.8 |
| C_SHARP | microsoft_security_codescan | 5.6.2 |
| TYPESCRIPT | eslint | v7.32.0 |
| tslint | 5.9.1 | |
| JAVASCRIPT | jshint | 2.9.5 |
| eslint | v7.32.0 | |
| GO | staticcheck | v0.2.1 |
| gosec | 2.8.1 | |
| gometalinter | v2.0.0 | |
| PYTHON | bandit | 1.7.0 |
| pylint | 2.11.1 | |
| dlint | 0.11.0 | |
| PHP | phpcs | 3.2.3 |
| phpmd | 2.6.1 | |
| RUBY | brakeman | 5.1.1 |
| KOTLIN | detekt | 1.18.1 |
| mobsfscan | 0.1.0 | |
| SOLIDITY | solhint | 3.3.6 |
| SWIFT | swiftlint | 0.32.0 |
| APEX | pmd | 6.39.0 |
| HTML | htmlhint | 0.15.1 |
| SQL | sqlcheck | 1 |
| CSS | stylelint | 14.15.1 |
| INFRASTRUCTURE | checkov | 2.0.654 |
| YAML | kubesec | 2.11.5 |
| LUA | luacheck | 0.23.0 |
Prerequisites to run remotescan for Swift
- Install xcode on your macOS
- Run below command and the output should be similar to the below screenshot
xcode-select -p

- If your output is not as above screenshot then run the below command
sudo xcode-select -s /Applications/Xcode.app/Contents/Developer
- Reverify the output of following command
xcode-select -p
- your final output should be as below screenshot

- Now run the remotescan
Configuration for https enabled Embold
- Import the same set of certificates used for Embold in default jre keystore on standalone Corona machine.
- Default jre path: Java/jre1.8.0_171/lib/security.
- Below is the command:
“keytool -import -trustcacerts -alias gamma -file “ ”-keystore cacerts”
Re-Analyse Snapshot
The Re-Analyse Snapshot feature allows users to update existing snapshots to reflect the latest code changes, ensuring accurate and up-to-date analysis.
Key Features:
- Snapshot Replacement:
Re-analysed snapshots replace older ones with the same timestamp, removing outdated data while maintaining consistency. - Timestamp Validation:
- On the Issues page, the left-side timestamp reflects the older snapshot, while the right-side timestamp shows the updated one.
- All timestamps in the updated snapshot will reflect newer data.
- Suppression Handling:
- Suppressed issues in earlier snapshots are retained in the re-analysed snapshot.
- If suppression is removed in the latest snapshot and re-analysed, the suppression data will no longer appear.
- Compatibility:
- Works with both remote and normal scans.
- Supports re-analysis for the most recent 30 snapshots.
- Gamma_Generic Compatibility:
- Generic issues will not appear on the UI if a CSV is not provided during re-analysis.
- Existing CSV files on the server are not replaced.
Benefits:
- Keeps issue tracking and suppression data accurate across snapshots.
- Provides a seamless way to reflect code changes without duplicating timestamps.
- Works across different environments and scan types.
This feature ensures that snapshots remain up-to-date and accurate, enabling better analysis and tracking.
Check below command for Reanalyse-Snapshot ;
embold-scanner analyse -c <./repository configuration.json> -u <Embold URL> -t <Embold TOKEN> -b <BASE_DIR> -d <DATA_DIR> -s <snapshot name> -r <REPO UID> -sh <CORONA PACKAGE PATH> -l <LOG_FOLDER> -sd <Snapshot_id>
To find the snapshot_id, navigate to the Snapshots section of the repository and click the Copy button next to the desired snapshot.

Additional configuration for Strict mode Embold Remote scan for C/CPP code
- For understanding EMbold strict mode analysis, refer link https://docs.embold.io/installation-and-backup-guide/#c-strict-mode
- In the above repository-configuration.json file, just add path of the compilation command json file generated by your build system under the section additionalOptions as follows
“additionalOptions” : [“–cdb=<Folder where the compilaton command json file is generated>”]
OR
Add the generated compilation_commands.json file under the baseDirectory path
embold-scanner will pick up the compilation command json file from either the path given with –cdb option or from the base directory.
Running analysis in strict mode
Set up your remote Embold instance. This is where your analysis results will be published. Follow the steps to set up remote analysis here.
- On your build machine, navigate to the base directory of your source folder. Generate the compilation database as explained here. You should be able to see a compile_commands.json file in your base directory.
- Install corona on your build machine as explained here for Ubuntu, Windows and RedHat Enterprise Linux/CentOS. For installer versions, refer this section.
- Login to Embold. Create a project. Link the repository you want to scan. Select a repository type as “remote“. Read more info creating a project and linking a repository.
- Select a repository and “Download repository configuration” from the drop down menu of a repository.
- Open and edit the repository-configuration.json file. Provide the URL of your remote machine where the Embold is running and also, set your token based authentication.
Note: Embold has deprecated the usage of username and password. Read more info. here. - In the sources section, set the value of baseDir as the base directory path of your source folder on your build machine. You can also give exclusions.
e.g. If you want to exclude folders named “build” and “test”, simply give “.*build.*” , “.*test.*” in the exclusions section.
For edting ANY settings involving paths, even if you are running Corona on Windows, you must use Unix style path seperator. E.g. forward slash and not backward slash. If you use normal Windows format, it will not work and result into an error message. - Set the dataDir to any desired location on your build machine.
- If you wish to create a separate build folder for running trace-utility (intercept-build), you should use the –cdb additional option while running the scan.
The compile_commands.json will be created inside your build directory and not in the base directory of your source folder. Since, the scanner looks for the compile_commands.json in the base directory by default, use the –cdb option to specify the directory where your compile_commands.json is located. - In “settings” section, under “additionalOptions” set the directory where compilation database resides.
Example:--cdb - Go to the bin directory inside the scanboxwrapper.
e.g. $corona_home/scanboxwrapper/bin.
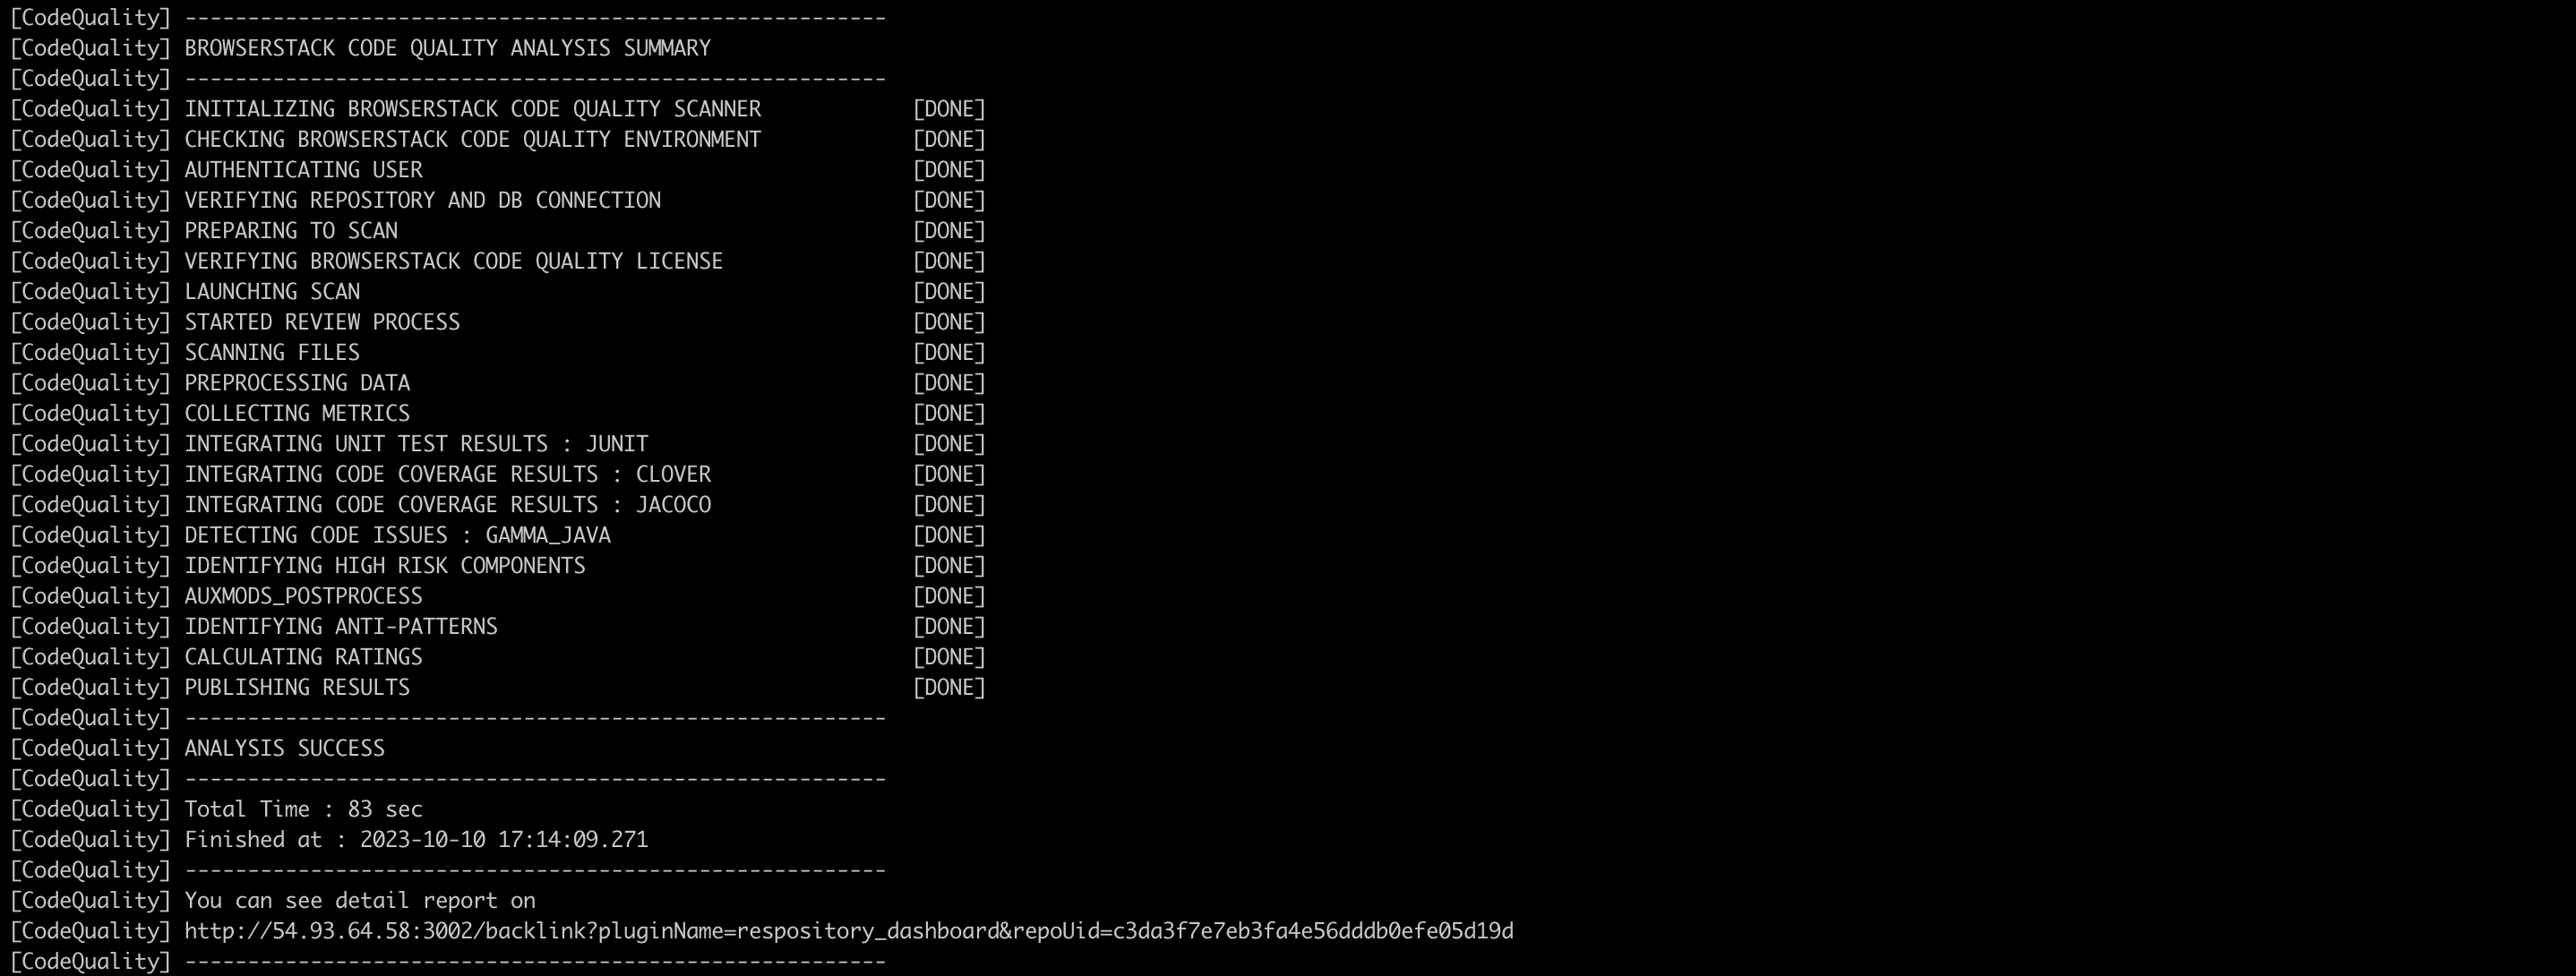
Run below command:/gammascanner -c/home/user/gamma/corona/scanboxwrapper/examples/gammascan_typical.json - If the scan is successful you should see “ANALYSIS SUCCESS”. On your build machine, the last two log messages indicate that the remote analysis was successful.
- On your remote Embold instance, you will be able to see published results.
Integrating Remote Scans into CI/CD Pipelines
This documentation provides step-by-step instructions on how to perform a remote scan using a shell script within a UI pipeline. The user only needs to replace their token, URL, and repository UID to scan a remote repository.
Note: The repository type must be set to remote
UI Instructions:
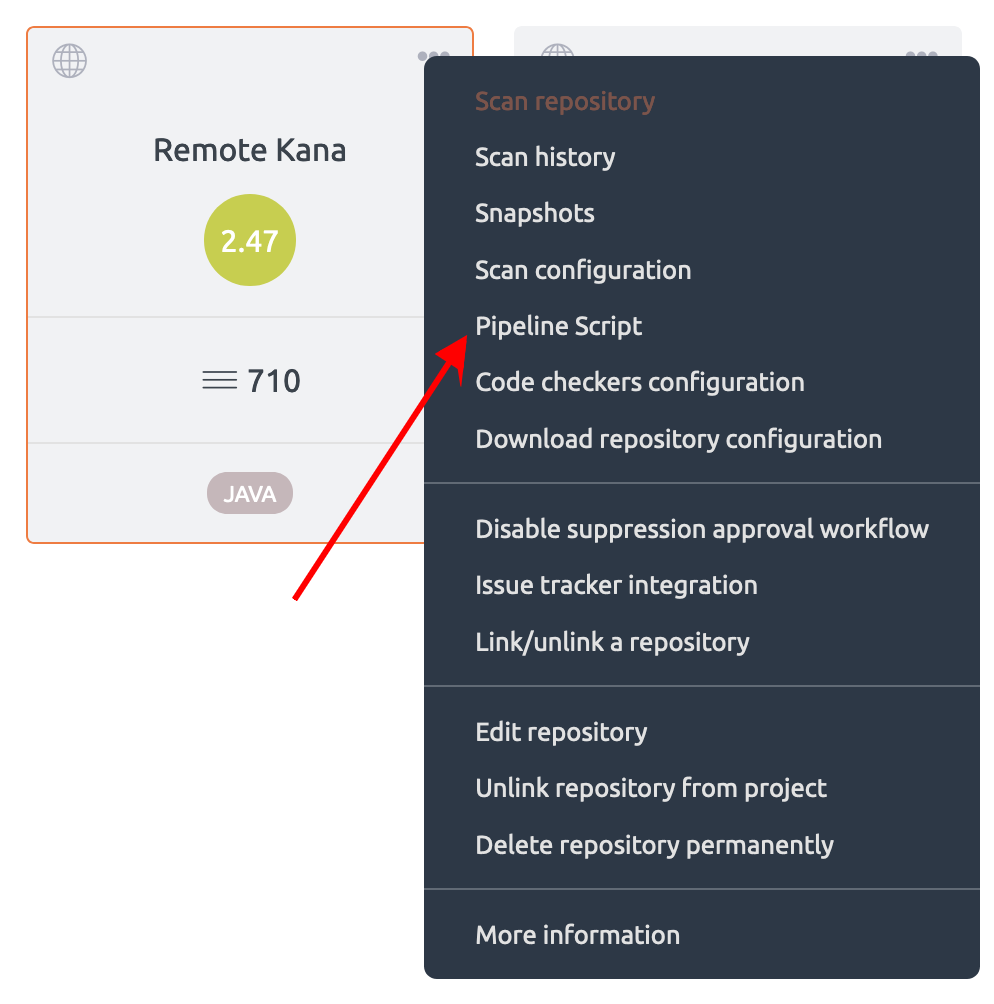
To view and copy the pipeline script:
- Navigate to the Repository Settings:
- Click on the three dots next to your repository.
- Select “Pipeline Script”:
- The automatically generated script can be copied and used for remote scanning.
- The automatically generated script can be copied and used for remote scanning.
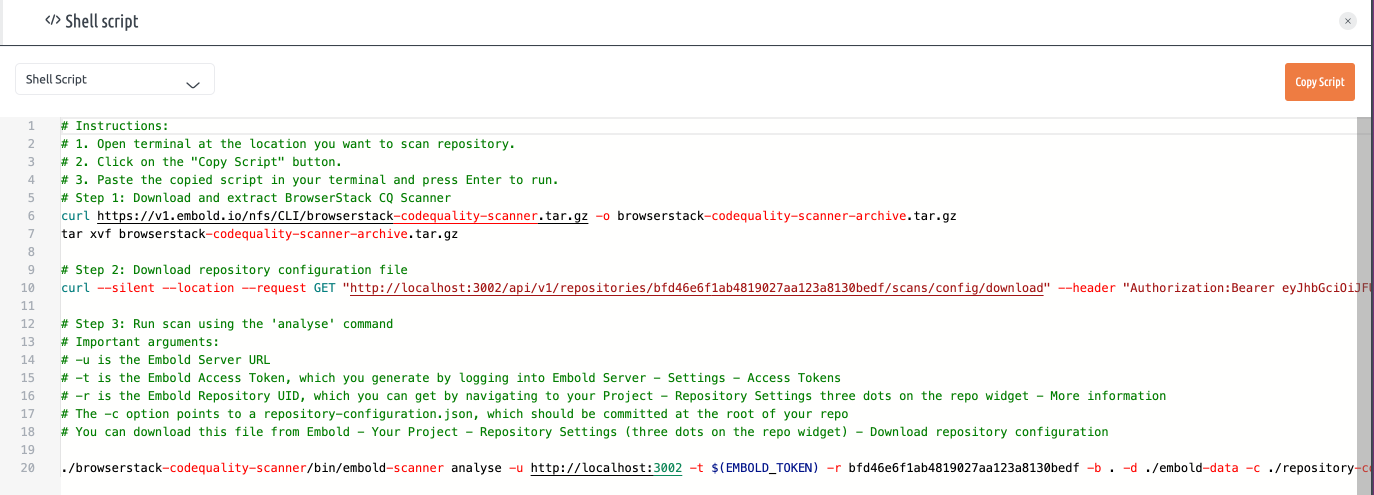
- Open Terminal:
- Navigate to the location where you want to scan the repository.
- Copy and Paste the Script:
- Paste the copied script into your terminal and press Enter to run
Important Arguments:
-u: Embold Server URL-t: Embold Access Token (Generate this by logging into Embold Server -> Settings -> Access Tokens)-r: Embold Repository UID (Find this by navigating to your Project -> Repository Settings (three dots on the repo widget) -> More Information)-c: Path torepository-configuration.json(Should be committed at the root of your repository. Download from Embold -> Your Project -> Repository Settings (three dots on the repo widget) -> Download Repository Configuration)
Scanning Specific Files with -lf Option
The -lf option allows user to scan only the files listed in a provided text file. This is useful to speed up scans and restrict results to only the relevant files.User can provide a text file containing relative file paths (one per line), and Embold will scan only those files for code issues.
Note: This is only supported in remote scan
The file which is provided with -lf option contain path in following format
src/main/java/com/example/Calculator.javasrc/test/java/com/example/CalculatorTest.java
User can use the following git command to generate a list of files that changed between two commits in a specific repository directory:git -C /absolute/path/to/repo diff --name-only <old_commit>^ <new_commit> > /absolute/path/to/changedfiles.txt
Example:
git -C /home/user/my-repo diff --name-only 1d2d347c3b3acfcab31d830f1a67908cb00dc9df^ 057209443711b927d2e7ae7d40dc51d7fc22c93f > /home/user/changedfiles.txt
- Replace
/home/user/my-repowith the absolute path to your Git repository. - Replace
/home/user/changedfiles.txtwith the desired absolute path where you want to save the list of changed files.
Now run Embold scan using -lf option
Syntax:
./embold-scanner analyse -c <config-file> -u <embold_url> -t <embold_token> -lf <path-to-the-file-list.txt>
<config-file>: Path to your Embold configuration JSON.<embold-url>: Your Embold server URL.<embold-token>: Your access token.<path-to-file-list.txt>: Text file listing relative paths of files to be scanned.
Example:
./embold-scanner analyse \
-c /Users/user/repository-configuration.json \
-u \
-t \
-lf /Users/user/changedfiles.txt
This will scan only the files listed in changedfiles.txt and publish issues relevant to them.
Coverage for Javascript
Embold enables users to include coverage data as part of the analysis for Javascript projects. However, Embold itself does not generate coverage reports. To incorporate coverage information, users must first use a third-party tool to create the coverage report. Once the report is ready, users need to configure Embold to locate and retrieve it. This ensures that the coverage data is displayed alongside other analysis results within the Embold UI.
Pre-requisites:
- The Embold Server must be running and properly configured. (version 1.9.26.4 or later)
- The user needs to have a build for their Javascript project, which includes coverage data as part of the test runs.
- The user should run the Embold scan on the same host where the Javascript project was built and the coverage data was generated.
- The reports should be in LCOV format.
Running remote-scan for coverage
- Run the
embold-scanner:- Go to Repository and click on three dot (…)
Note: The repository type must be set toremote.
Go to Repository and click on three dot (…)
- Click on
Pipeline Script
- Copy the shell script

- Add the
EMBOLD_TOKENvariable in script - Run the script
- Customization for shell script
- If user want to download embold-scanner manually then comment line number 6 and 7 and run the script where the embold-scanner is located.
- If user want to download repository configuration json manually comment line number 10 and pass the path of repository configuration json file along with option
-cand run the script where the embold-scanner is located. - In the repository configuration JSON, the Istanbul module is enabled by default, and the value for
reportDiris set tobaseDirby default. If the user wants to specify a different location for saving the coverage reports, they should provide the parent directory path of the reports for thereportDirvalue in repository-configuration.json
- Go to Repository and click on three dot (…)
- Navigate the Coverage section on Embold UI to see the coverage data:


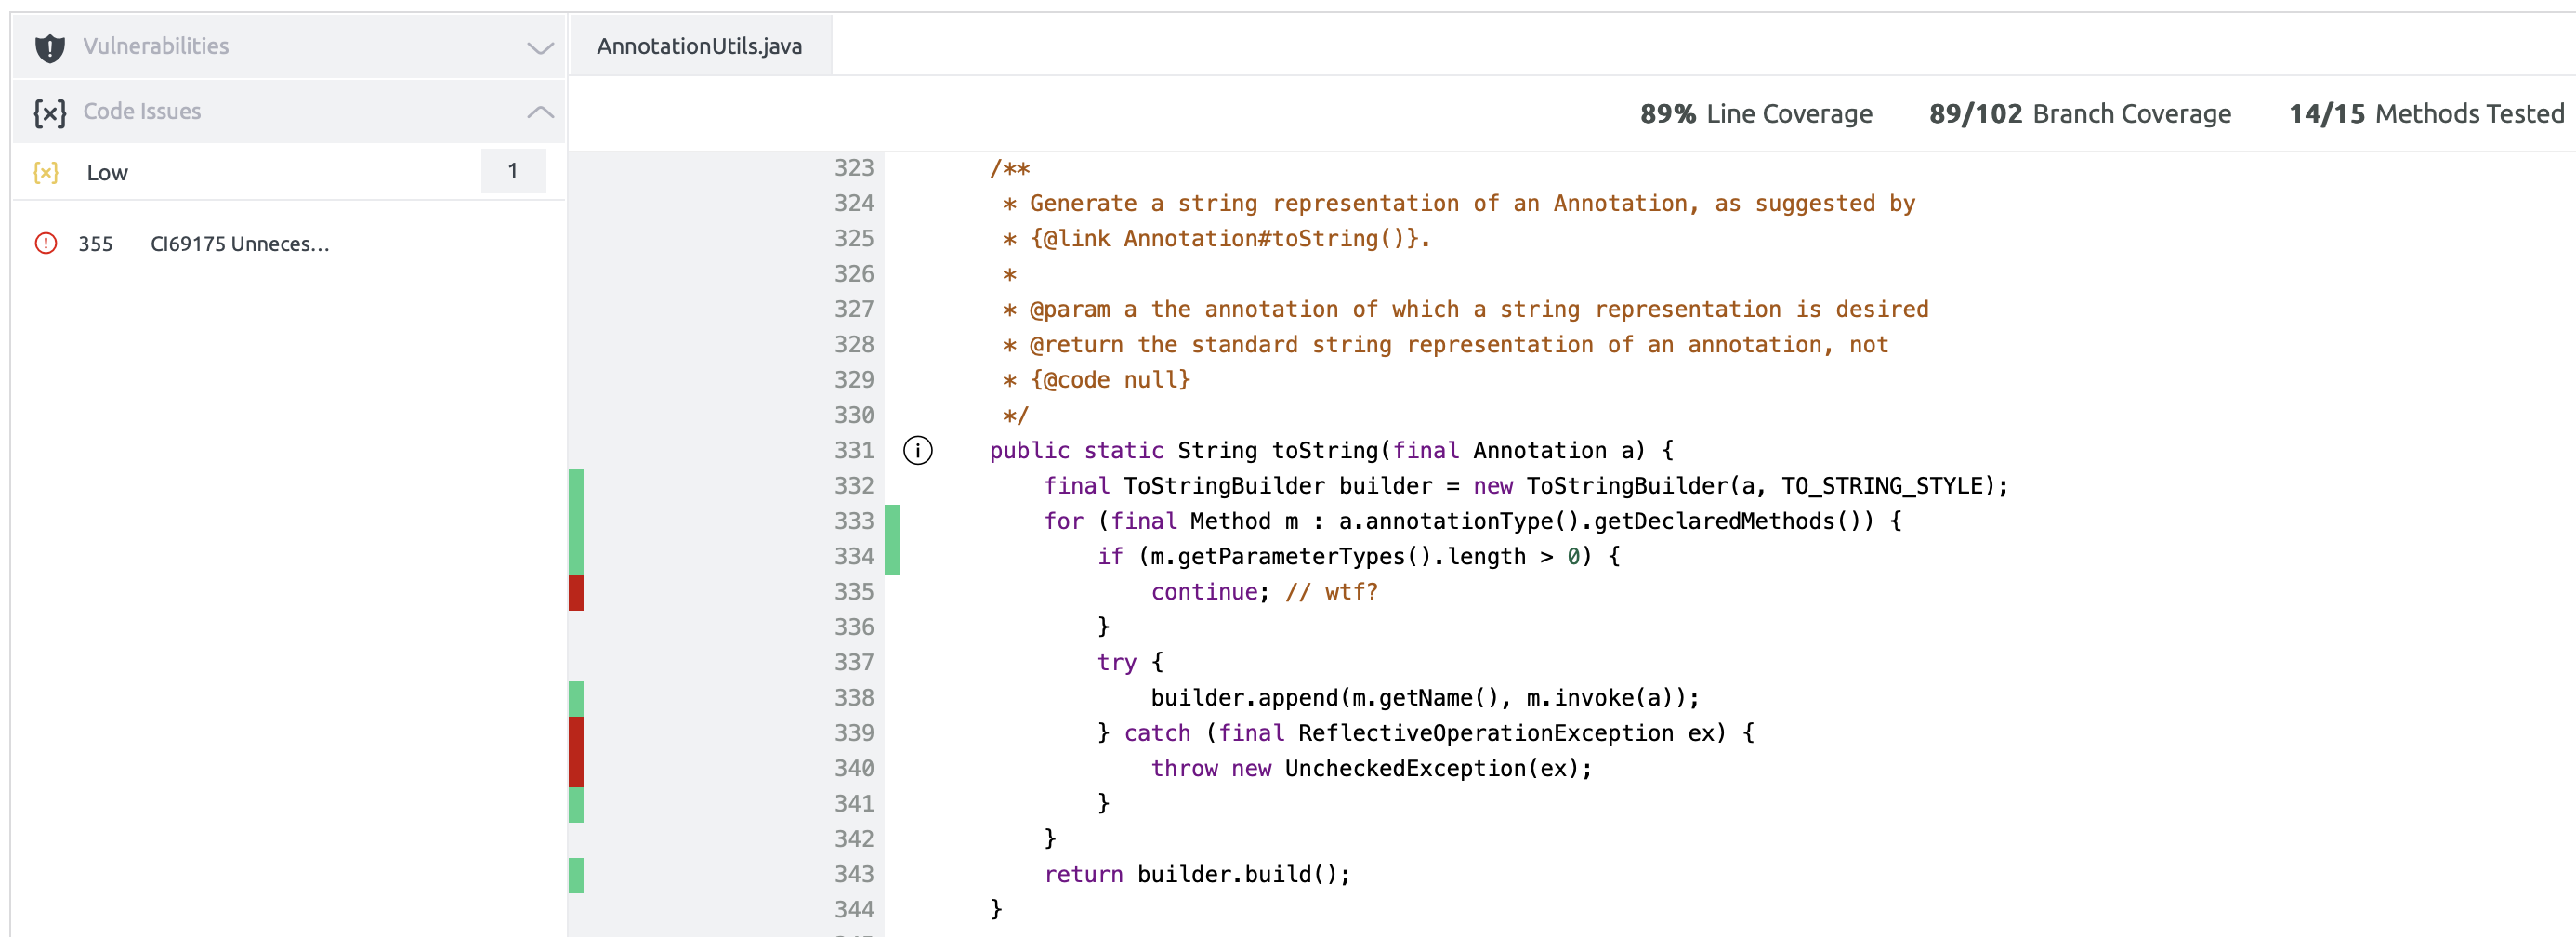
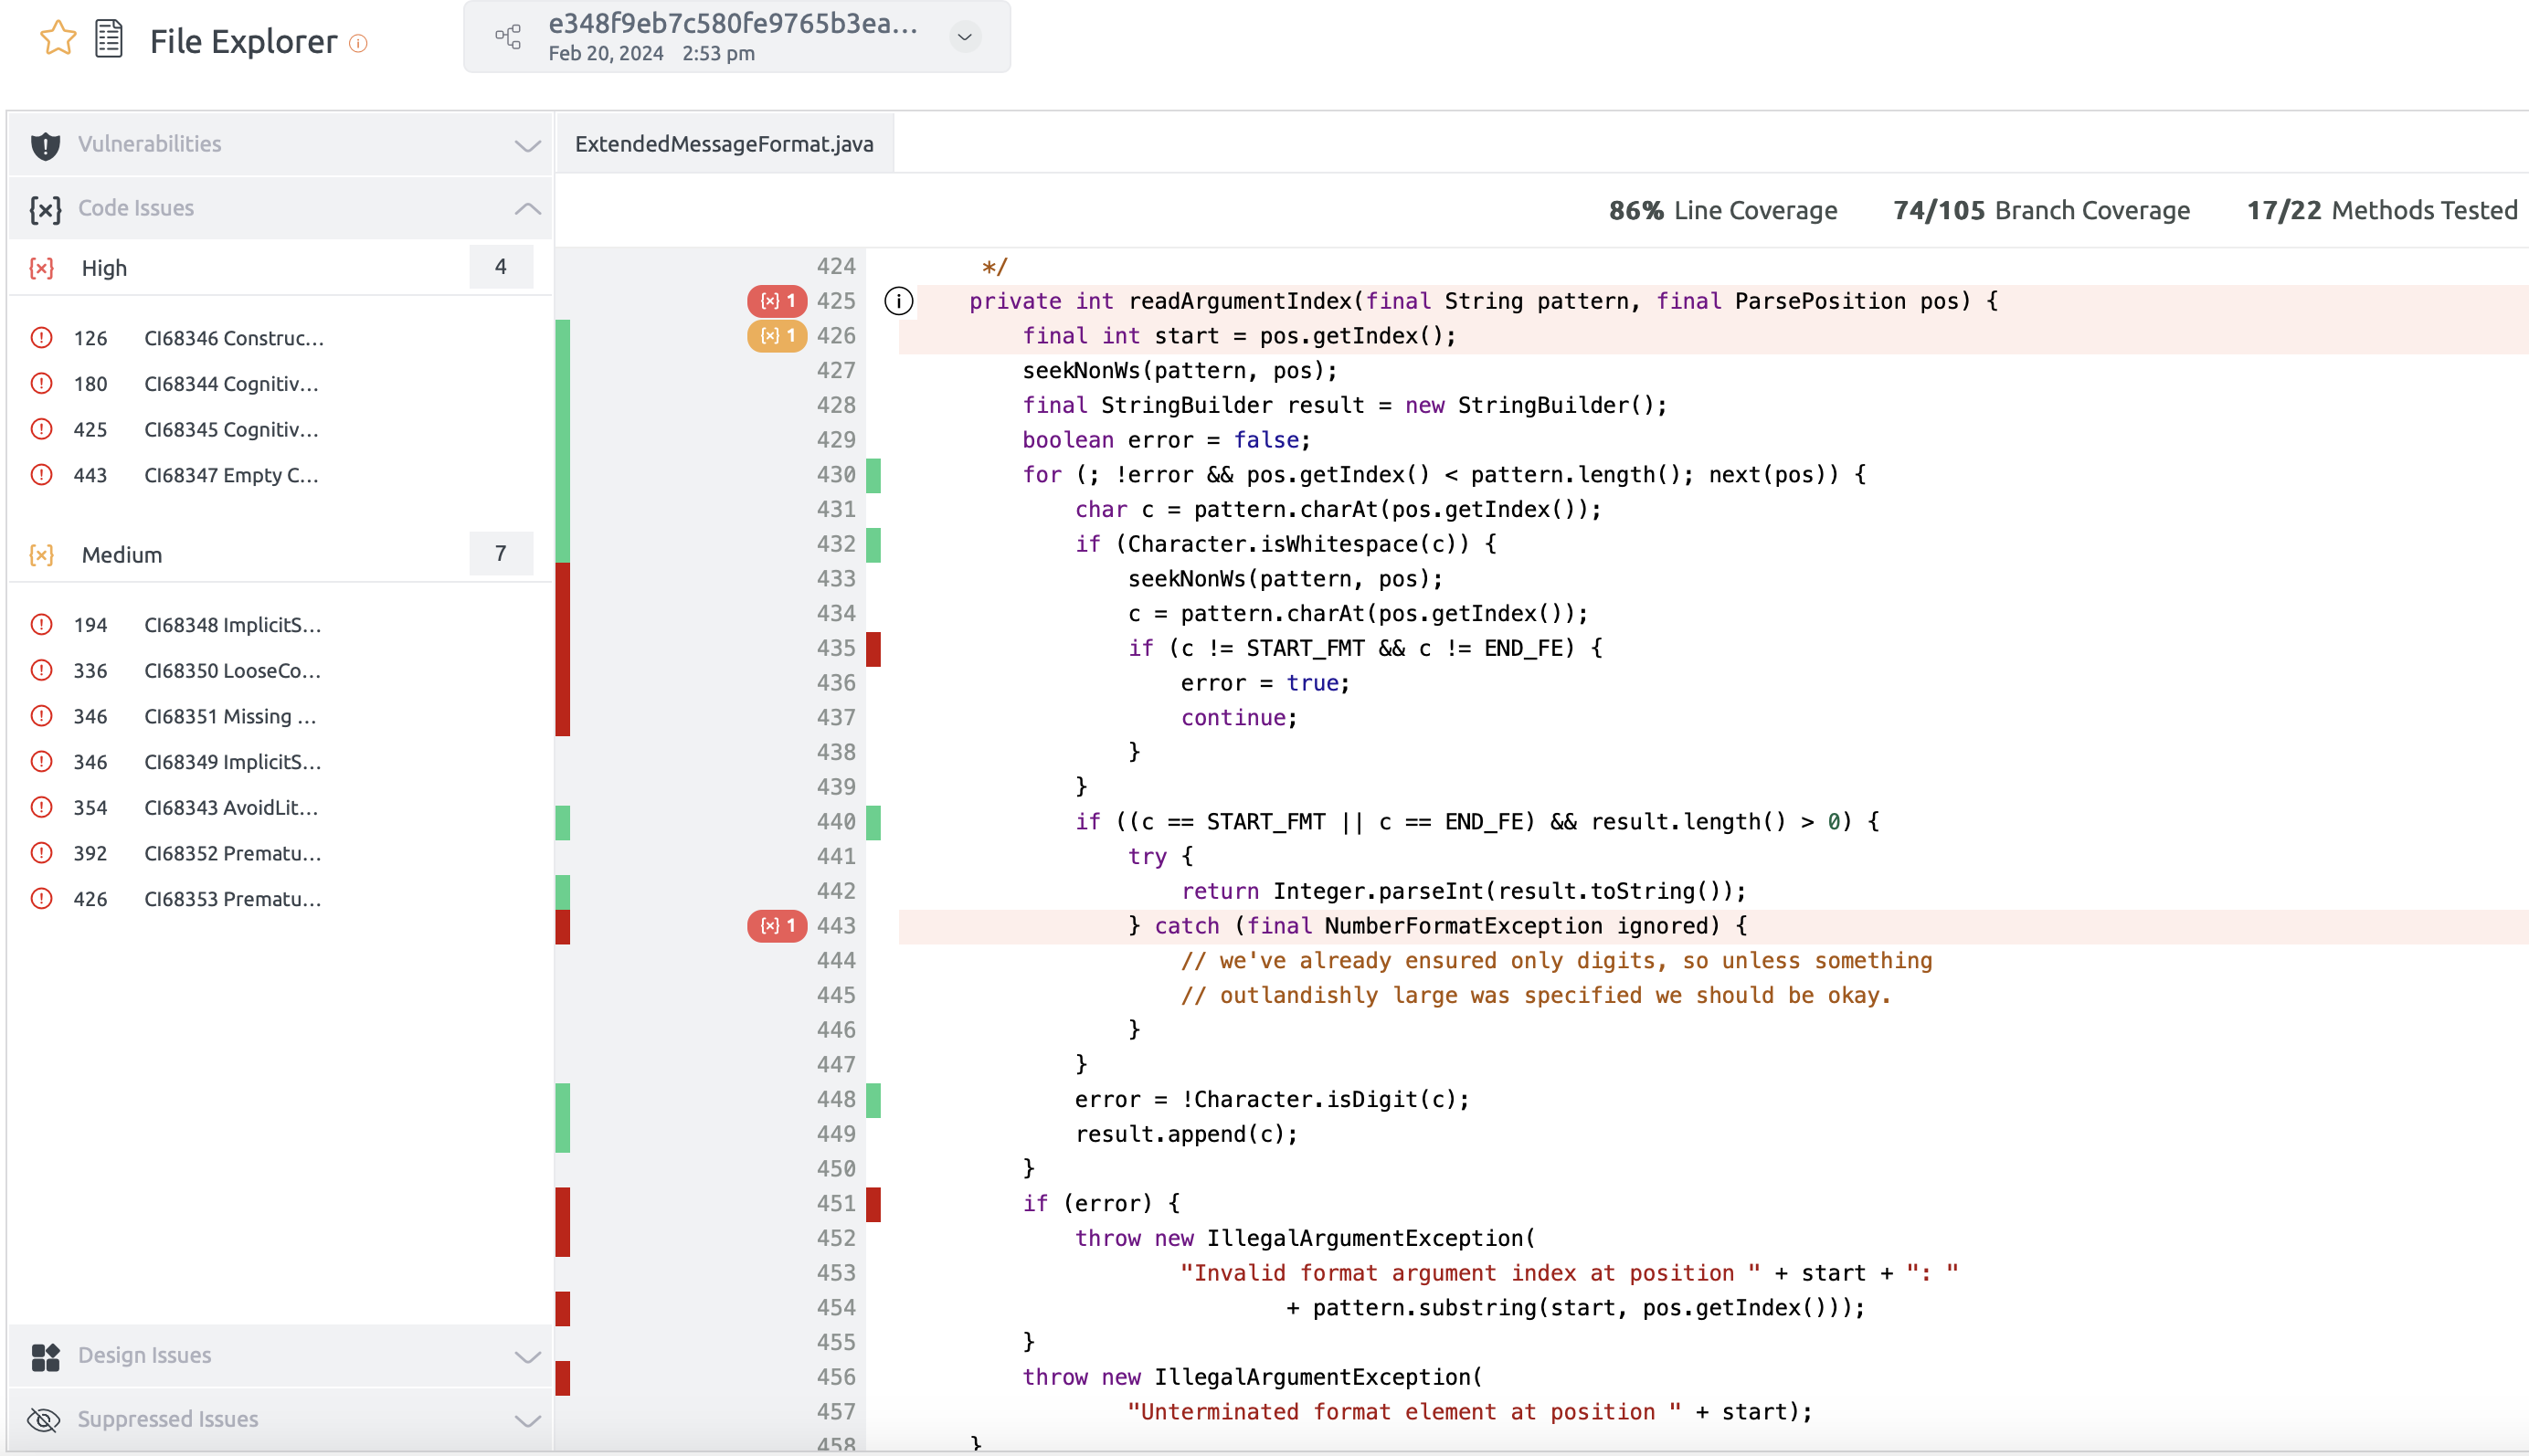
Coverage for Java
Embold enables users to include coverage data as part of the analysis for Java projects. However, Embold itself does not generate coverage reports. To incorporate coverage information, users must first use a third-party tool to create the coverage report. Once the report is ready, users need to configure Embold to locate and retrieve it. This ensures that the coverage data is displayed alongside other analysis results within the Embold UI.
Full Workflow Example
End-to-End Configuration in Azure Repository
Pre-requisites:
- The Embold Server must be running and properly configured.
- The user needs to have a build for their Java project, which includes JaCoCo coverage data as part of the test runs.
- The user should run the Embold scan on the same host where the Java project was built and the JaCoCo data was generated.
- The reports should be in XML format.
Running remote-scan for coverage
- Go to Embold UI repo and click on three dot (…) then click on
Pipeline Script
Note: The repository type must be set toremote.
- Copy the shell script

- Add the
EMBOLD_TOKENvariable in script - Customization for shell script
- If user want to download embold-scanner manually then comment line number 6 and 7.
- If user want to download repository configuration json manually comment line number 10 and pass the path of repository configuration json file along with option
-c. - In the repository configuration JSON, the jacoco module is enabled by default. The user should specify the parent directory of the coverage reports in the
reportDirvalue inrepository-configuration.json
- Run the script
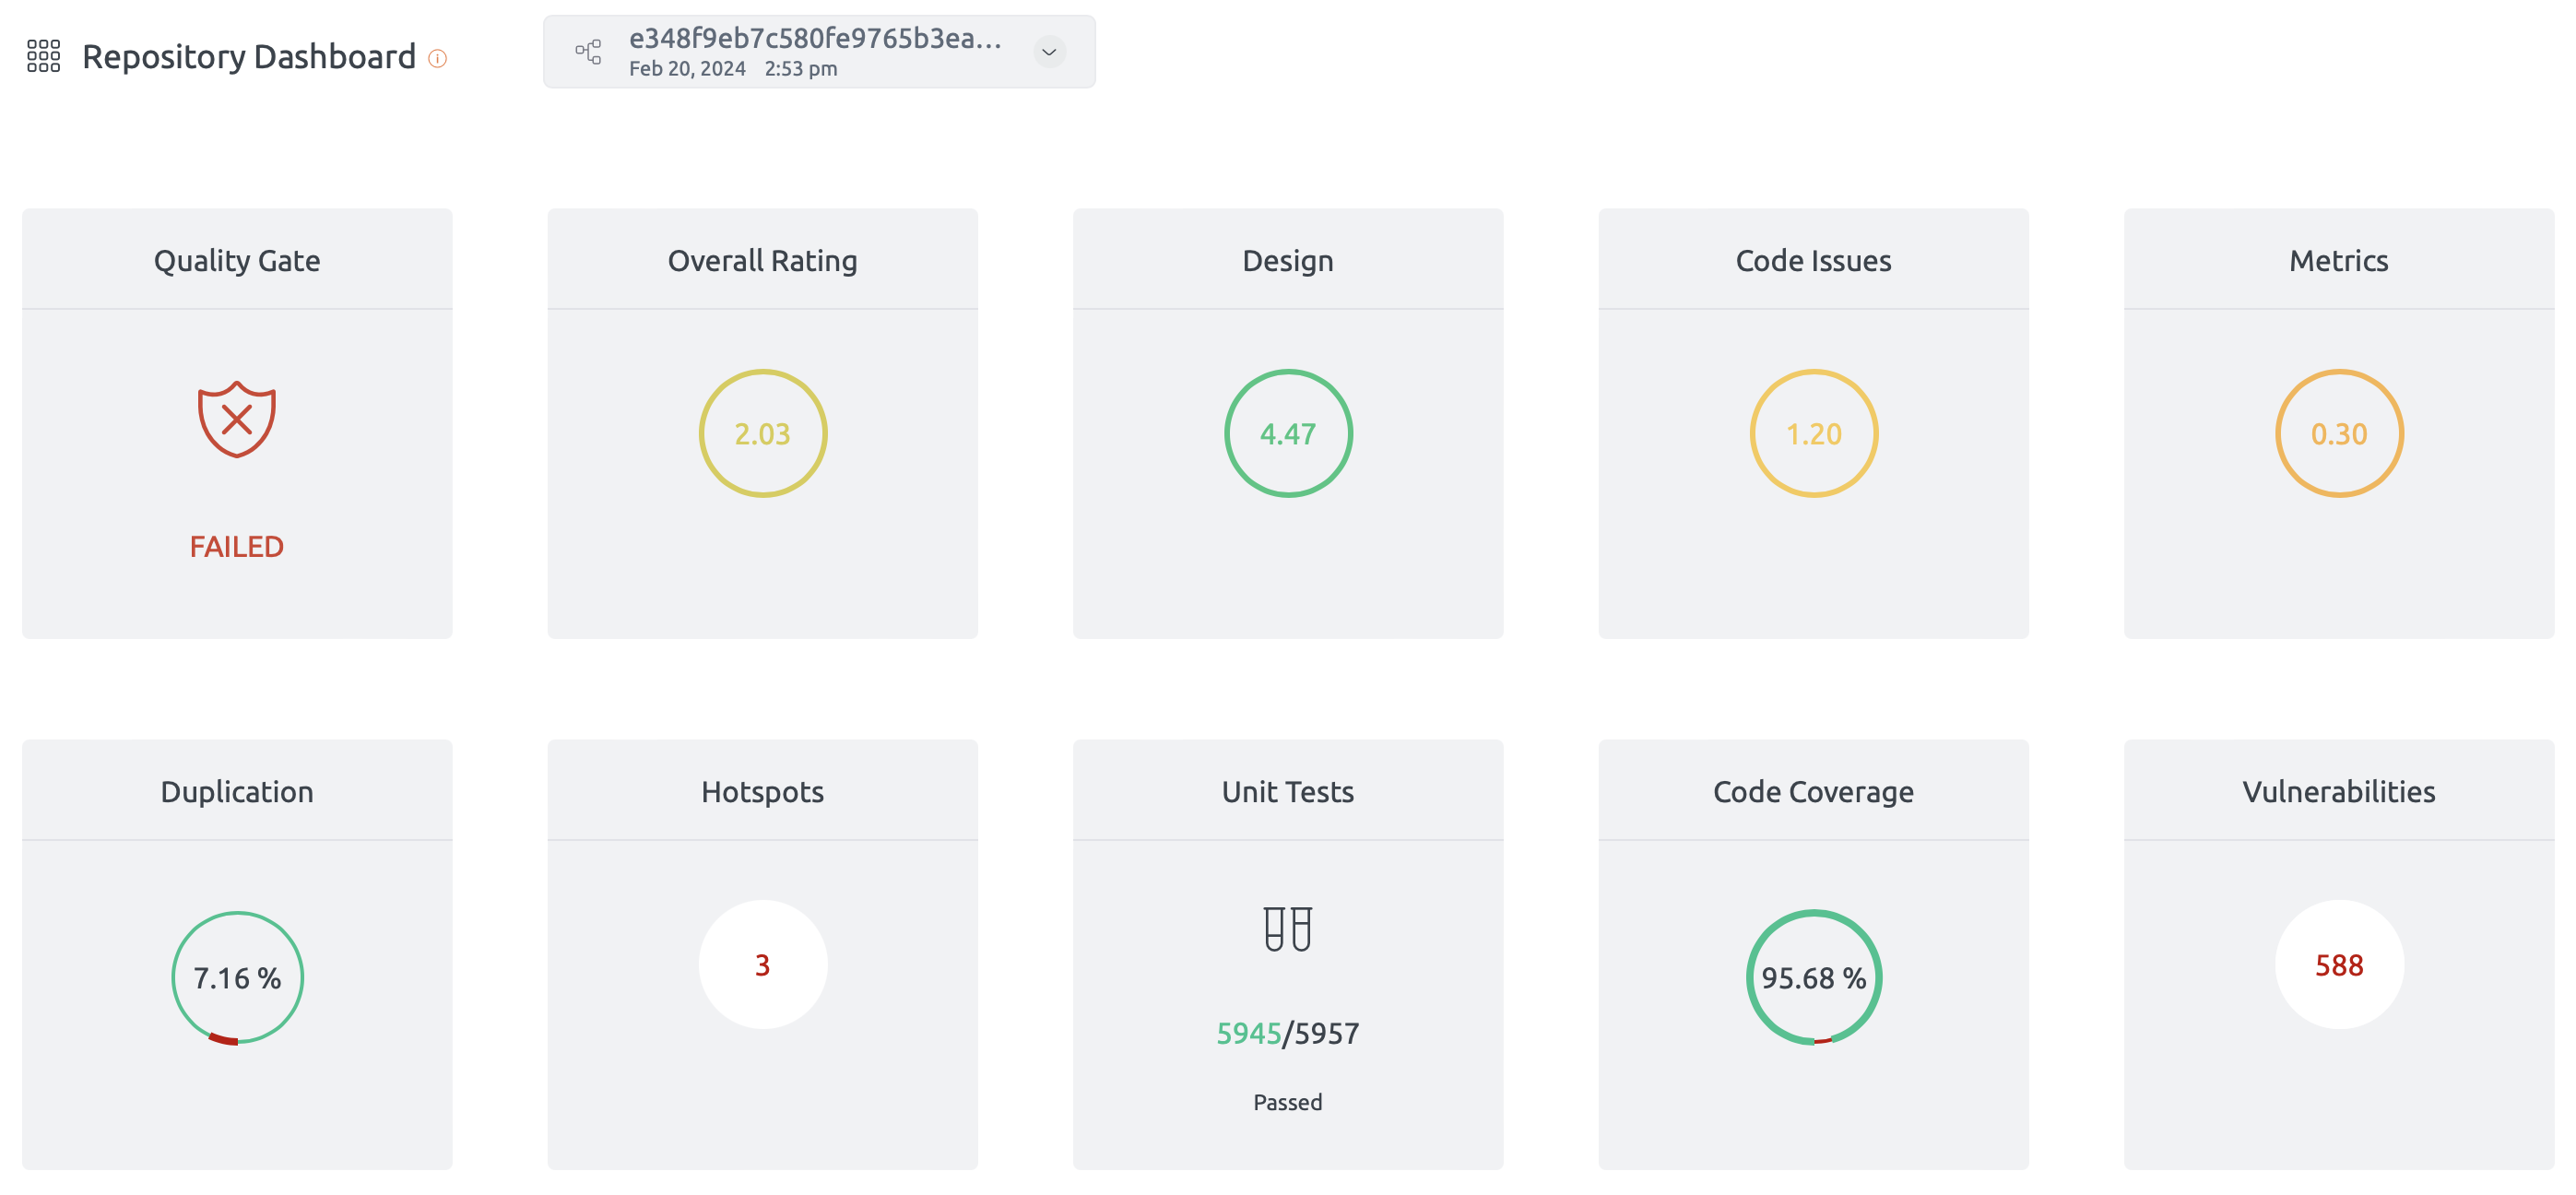
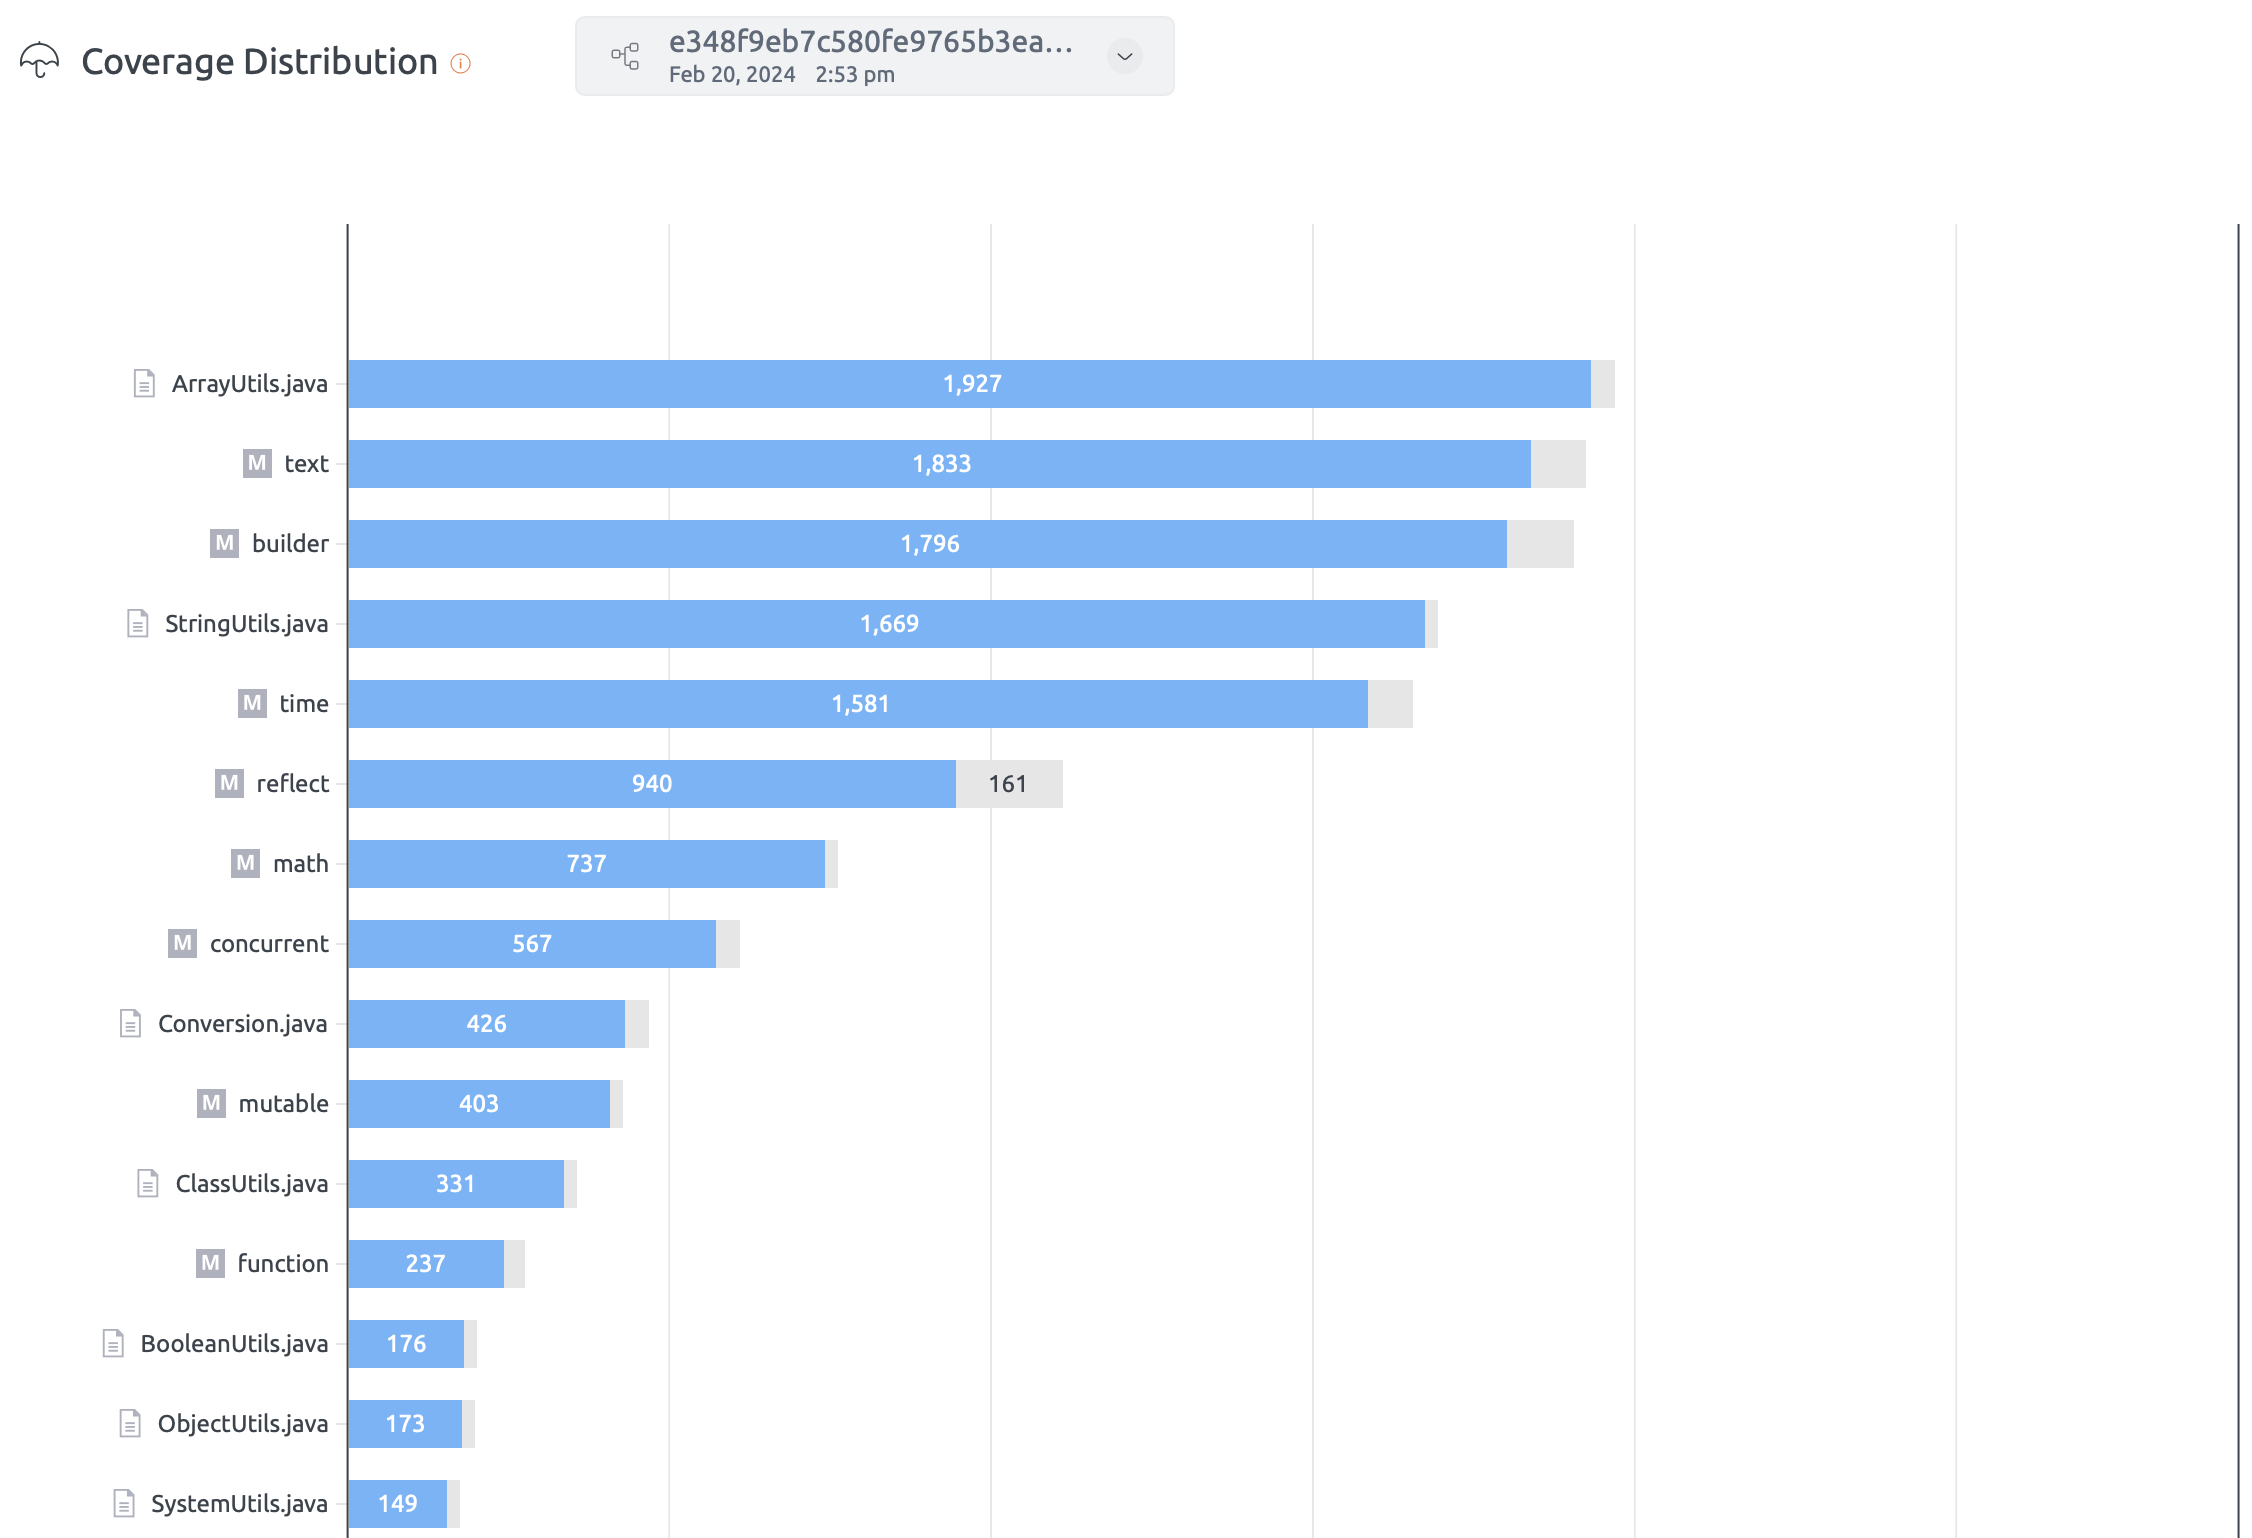
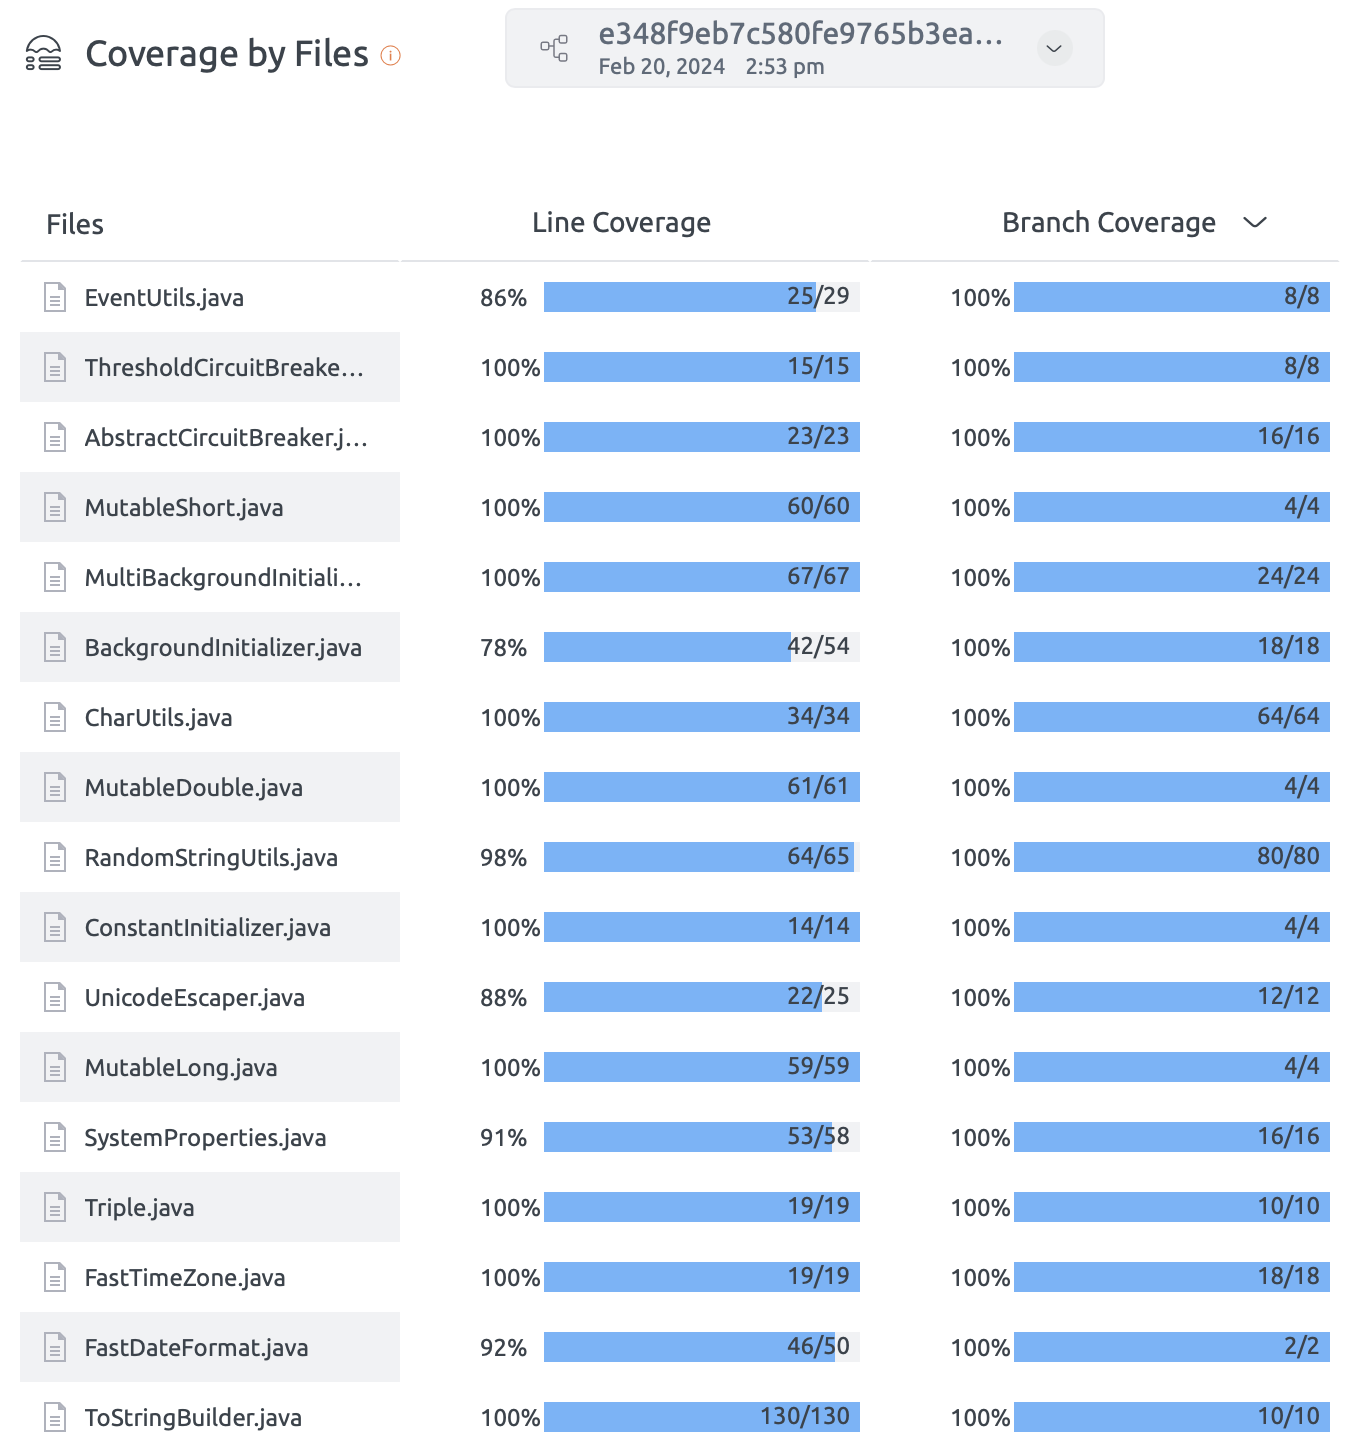
- Navigate the Coverage section on Embold UI to see the coverage data:
Coverage for Python
Embold enables users to include coverage data as part of the analysis for Python projects. However, Embold itself does not generate coverage reports. To incorporate coverage information, users must first use a third-party tool to create the coverage report. Once the report is ready, users need to configure Embold to locate and retrieve it. This ensures that the coverage data is displayed alongside other analysis results within the Embold UI.
Pre-requisites:
- The Embold Server must be running and properly configured. (version 1.9.26.4 or later)
- The user needs to have a build for their Python project, which includes coverage data as part of the test runs.
- The user should run the Embold scan on the same host where the Python project was built and the coverage data was generated.
- The reports should be in LCOV format.
Running remote-scan for coverage
- Run the
embold-scanner:- Go to Project and click on three dot (…)
Note: The repository type must be set toremote.
- Click on
Pipeline Script
- Copy the shell script

- Add the
EMBOLD_TOKENvariable in script - Run the script
- Customization for shell script
- If user want to download embold-scanner manually then comment line number 6 and 7 and run the script where the embold-scanner is located.
- If user want to download repository configuration json manually comment line number 10 and pass the path of repository configuration json file along with option
-cand run the script where the embold-scanner is located. - In the repository configuration JSON, the coveragepy module is enabled by default, and the value for
reportDiris set tobaseDirby default. If the user wants to specify a different location for saving the coverage reports, they should provide the parent directory path of the reports for thereportDirvalue in repository-configuration.json
- Go to Project and click on three dot (…)
- Navigate the Coverage section on Embold UI to see the coverage data:


Unit Test for C/CPP (Gtest)
Embold allows users to include Google Test (GTest) results as part of the analysis for C/C++ projects. However, Embold itself does not execute tests or generate test reports. To integrate test results, user must first run GTest and generate a report using a supported format(XML). Once the report is available, users need to configure Embold to locate and process it. This ensures that test results are displayed alongside other analysis insights within the Embold UI.
Pre-requisites:
- The Embold Server must be running and properly configured.
- The user needs to have a build for their C/C++ project, which includes GTest data as part of the test runs.
- The user should run the Embold scan on the same host where the C/C++ project was built and the GTest data was generated.
- The reports should be in XML format.
Running remote-scan for GTest
- Run the
embold-scanner:- Go to Project and click on three dot of repository(…)
Note: The repository type must be set toremote. - Click on
Pipeline Script
- Copy the shell script

- Add the
EMBOLD_TOKENvariable in script
- Customization for shell script
- If user want to download embold-scanner manually then comment line number 6 and 7.
- If user want to download repository configuration json manually comment line number 10 and pass the path of repository configuration json file along with option
-c. - In the repository configuration JSON, the gtest module is enabled by default, and the value for
reportDiris set tobaseDirby default. If the unit test reports are stored in a different location, the user should specify the parent directory of the reports in thereportDirvalue inrepository-configuration.json
- Run the script.
- Go to Project and click on three dot of repository(…)
- Navigate the Unit Tests section on Embold UI to see the unit test data:


Unit Test for C/CPP(CTest)
Embold allows users to include CTest results as part of the analysis for C/C++ projects. However, Embold itself does not execute tests or generate test reports. To integrate test results, user must first run CTest and generate a report using a supported format(XML). Once the report is available, users need to configure Embold to locate and process it. This ensures that test results are displayed alongside other analysis insights within the Embold UI.
Pre-requisites:
- The Embold Server must be running and properly configured.
- The user needs to have a build for their C/C++ project, which includes CTest data as part of the test runs.
- The user should run the Embold scan on the same host where the C/C++ project was built and the CTest data was generated.
- The reports should be in XML format.
Running remote-scan for CTest
- Go to Project and click on three dot of repository(…)
Note: The repository type must be set toremote.
- Click on
Pipeline Script.
- Copy the shell script

- Add the
EMBOLD_TOKENvariable in script
- Customization for shell script
- If user want to download embold-scanner manually then comment line number 6 and 7.
- If user want to download repository configuration json manually comment line number 10 and pass the path of repository configuration json file along with option
-c. - In the repository configuration JSON, the ctest module is enabled by default, and the value for
reportDiris set tobaseDirby default. If the unit test reports are stored in a different location, the user should specify the parent directory of the reports in thereportDirvalue inrepository-configuration.json
- Run the script.
- Click on
- Navigate the Unit Tests section on Embold UI to see the unit test data.
Coverlet Integration
For more information about the execution of Coverlet integration, refer to this article.
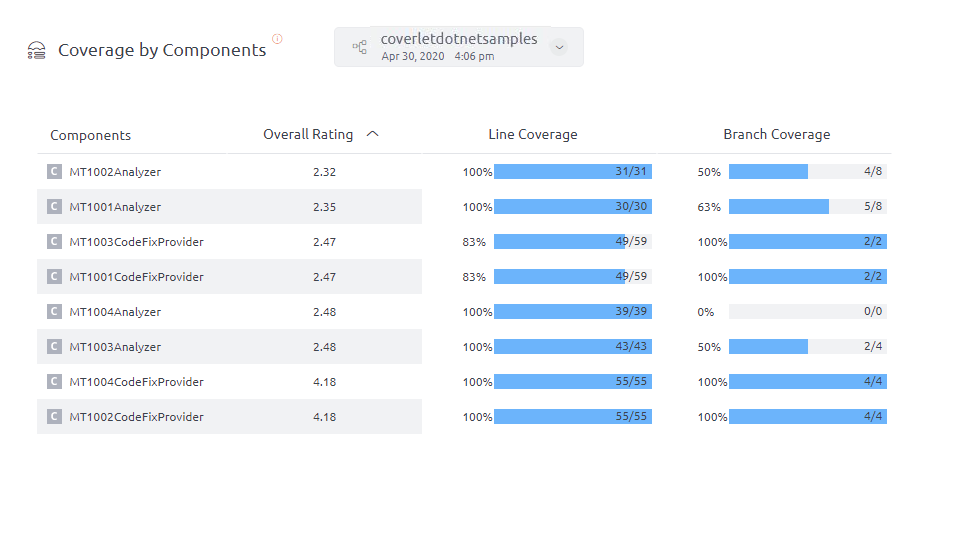
UI output of coverage through coverlet can be seen in the Coverage by components section as below:
For Linux users, please check below points:
There is an issue with MSBuild on Linux that affects the ability to escape quotes while specifying multiple comma-separated values. Linux MSBuild automatically translates to / in properties, tasks, etc. before using them, which means if you specified /p:CoverletOutputFormat="json,opencover” in an MSBuild script, it will be converted to /p:CoverletOutputFormat=/"json,opencover/" before execution. This yields an error similar to the following:MSBUILD : error MSB1006: Property is not valid. [/home/vsts/work/1/s/default.proj]
Switch: opencover/
You’ll see this if directly consuming Linux MSBuild or if using the Azure DevOps MSBuild task on a Linux agent.
The workaround is to use the .NET Core Dotnet MSBuild command instead of using MSBuild directly. The issue is not present in Dotnet MSBuild and the script will run with correctly escaped quotes.
Limitations
For more information, refer to this article.
Troubleshooting
- Coverlet module logs are generated inside
workspace/projectName/gamma_logs/{repositoryUID}/ext_coverlet.log
MSTest Integration
This section will help you to integrate MSTest (.Net unit test framework) tool on your local instance.
Prerequisites
- MSBuild version should be 15 or 16 depending on the type of source code that needs to be scanned.
- MSTest (does not require Visual Studio) can be separately downloaded as Test Agent Module.
Assumption
- MSTest/MSBuild should run in the client environment’s existing setup.
For more information about the execution of MSTest, refer to this article.
Limitations
- MSTest exe takes only a DLL executable; hence, the path of the executable is very specific to the arguments provided.
Troubleshooting
- In spite of having Visual Studio setup, if MSTest.exe is not present on your Jenkins machine, make sure you update the installation because you may have installed minimal components and not the full IDE. Also, sometimes the test components are explicitly loaded on drives, other than C drive.
- If Embold analysis succeeds only with an “INITIALIZING GAMMASCANNER” success message and git exceptions for fetching the repository, the JSON given for the scan config is invalid.
- MSTest module logs are generated inside
workspace/projectName/gamma_logs/{repositoryUID}/ext_mstest.log
Building C# projects in Jenkins:
While building the project from Jenkins, the following errors may occur:
MSBUILD : error MSB1009: Project file does not existMSBUILD : error MSB1008: Project file does not exist
Solutions
%WORKSPACE% value has space in it ( C:/Program Files(x86/Jenkins/jobs/MSTest-Examples.Tests-Build/workspace) ), hence, it can break it into 2 arguments.
In this case, you need to move your Job’s workspace to a location that won’t have spaces in it. You can do in either of the following ways:
- Relocate your whole Jenkins’ installation out of “Program Files“,
- Or, Use custom workspace (click on the Advanced… button on the project configuration page, under Advanced Project Options)
%WORKSPACE% in MSBuildConfig build step with Custom Workspace value set in the above step. Snapshots
A snapshot represents the state of your source code at any given point in time. After every successful scan, a new snapshot is generated. While exploring various data visualisations, you can choose any snapshot to see results for that point in time.
To manage snapshots, select the Snapshots option from the
The number of snapshots you can store on each repository is dependent on your BrowserStack Code Quality license.
Example:
If your snapshot quota is 30 and your limit is exhausted, when you initiate the 31st scan, BrowserStack Code Quality will delete the earliest snapshot to make room for the new snapshot.
To avoid accidental deletion of snapshots by BrowserStack Code Quality, select the Keep snapshot option from Snapshots pop-up.
As per your preference, you can delete a snapshot manually by clicking the x button.

