Installation with docker
Prerequisites
Operating system
For Docker-based installation, any Linux distribution with Docker support is required. Ensure that all necessary Docker dependencies are set up before proceeding with the installation. Further information on the compatibility of Docker CE and EE can be found on the Docker help center: https://docs.docker.com/install/overview/
Hardware
- We recommend a minimum of 2 dedicated cores
- For projects > 1 Mio. Lines of code 4 cores are recommended
- For projects > 3 Mio. Lines of code 8 cores are recommended.
Memory
- Minimum 8 GB RAM (dedicated)
- For projects > 1 Mio. Lines of code 16 GB RAM are recommended
- For projects > 3 Mio. Lines of code 32 GB RAM are recommended.
Storage
- Minimum of 100 GB storage
- Should be expandable to support a growing analysis history
- The table below gives an indication on the growing storage requirements:
| Lines of Code | Storage size of 1 full snapshot |
| 100.000 | About 70-90MB |
| 1.000.000 | About 700MB – 1.2GB |
| 2.000.000 | About 1.2 – 2GB |
Table 1:Storage estimations
Network
During Installation
- The instance needs to be accessible through SSH.
After Installation
- One port needs to be exposed to access BrowserStack Code Quality via HTTP on the browser (by default port 3000)
- For remote scans where scans run on a build machine and results are published to the BrowserStack Code Quality server, port 5432 also needs to be exposed
- Connectivity to all external systems that should be integrated is required on the relevant ports-
- This includes connectivity to the repositories (i.e. git, GitHub, GitLab, TFS, SVN) on the required ports (i.e. HTTPS, SSH)
- If CI integration is required, connectivity between BrowserStack Code Quality on the CI system is required
- If task management is required, connectivity between BrowserStack Code Quality and the task management system needs to be there (i.e. for Jira, Teamforge)
Installing Docker engine
Docker engine needs to be installed on the host prior to installing the BrowserStack Code Quality Docker image.
Depending on your OS, refer the following steps to setup Docker Engine.
A. Docker Engine on CentOS
Follow the steps listed at this link.
B. Docker Engine on Ubuntu
Follow the steps listed at this link.
Environment Variables
| Environment variable | Use |
|---|---|
| ACCEPT_EULA | Set to "Y" (Yes) to confirm your acceptance of the [End-User Licensing Agreement (EULA)](https://docs.embold.io/eula/). This is a mandatory setting to use the software, acknowledging that you agree to the terms and conditions outlined in the agreement. |
| gamma_ui_public_host | Specifies the URL that can be accessed from the public domain. This setting is used to define the publicly accessible address for the Gamma UI, ensuring that users outside the internal network can access the application or services through this URL. (e.g gamma_ui_public_host=http://192.168.2.91:300/ or gamma_ui_public_host=https://example-domain.com) |
| ssl_key | Specifies the file path to the private key used in SSL (Secure Sockets Layer) communication. This key is essential for encrypting and decrypting data during secure connections, ensuring data integrity and confidentiality. |
| ssl_cert | The file path to the SSL certificate (`.cert` file) used for establishing secure, encrypted connections. This certificate is required to authenticate the server and encrypt communication. |
| ssl_port | Specifies the port number used for SSL (Secure Sockets Layer) communication. It defines the network port on which secure connections (using SSL/TLS) are established for encrypted data transfer |
| ssl_passphrase | The passphrase required to unlock and use SSL certificates that are secured with a private key. This is typically used for authenticating encrypted communications in secure connections. |
| ROOT_CERTS_PATH | The variable indicates the directory where the application or service running in the Docker container should look for root certificates. In this ROOT_CERTS_PATH=/opt/gamma/certs case, the path /opt/gamma/certs is inside the container. |
| EMB_PROXY_HOST or emb_proxy_host | The hostname of your proxy server (e.g., proxy.example.com) |
| EMB_PROXY_PORT or emb_proxy_port | The port number used by the proxy server (e.g., 3128) |
| EMB_PROXY_USERNAME or emb_proxy_username | The username for proxy authentication (if required) |
| EMB_PROXY_PASSWORD or emb_proxy_password | The password for proxy authentication (if required) |
| HTTP_PROXY or http_proxy | The URL of your HTTP proxy, including authentication details if necessary (e.g., http://proxy_user:password@proxy.example.com:8080). |
| HTTPS_PROXY or https_proxy | The URL of your HTTPS proxy, including authentication details if necessary (e.g., https://proxy_user:password@proxy.example.com:8080). |
| NO_PROXY or no_proxy | A list of hostnames, IP addresses, or domains that should bypass the proxy. For example: localhost,127.0.0.1,.example.com Excluding Multiple Servers To exclude multiple servers, use the | separator within double quotes. For example: no_proxy="http://localhost:3000|http://3.72.41.7:3128" |
| EMB_SCM_TRUST_SERVER_CERT | A boolean flag (true/false) that specifies whether to trust self-signed certificates in SCM (Source Control Management) systems. Enabling this option (`true`) allows connections to SCM servers with self-signed certificates, bypassing certificate validation. This is useful when working in environments with custom or non-verified certificates. |
| EMB_USE_NATIVE_PYPARSER | A boolean flag (true/false) that determines whether to use the native Python parser for analyzing Python code. Enabling this option (`true`) allows the use of the native parser, which may provide better accuracy or performance for Python code analysis, depending on the implementation. |
| ANALYSER_XMX | ANALYSER_XMX specifies the maximum heap memory allocation for the Java Virtual Machine (JVM) used during remote scans in Embold. |
| EMB_ANALYSER_THREADS | Defines the number of threads used by the analyzer during scans in Embold. Increasing the number of threads allows for parallel processing, significantly improving performance, especially when scanning large repositories. |
| EMB_PARSER_THREADS | Specifies the number of threads allocated for the parsing phase in Embold. This setting is crucial for improving performance during the parsing of large repositories, as it enables parallel processing of files |
| EMB_CHECKER_THREADS | Specifies the number of threads to be allocated for running checkers during the code analysis process. |
Installation on docker
Using archive file
This article gives step-by-step instructions for the installation of docker using a docker archive file.
This document assumes the following BrowserStack Code Quality versions:
EMBOLD_VERSION=1.9.33.0
If you are using a later version, please replace EMBOLD_VERSION with the corresponding values.
You can export these variables for the rest of the commands in this document to work.
Code Quality Components
Code Quality is made up of the following components:
- Code Quality Server (Docker container)
- This is the server component that hosts the results via a web interface and exposes results via APIs.
- The server can also initiate scans directly from the web interface by connecting it to a Git/SVN/TFS repo or just by uploading a ZIP file.
- Although for C/C++, we recommend running the scan on a build machine so BrowserStack Code Quality sees the source exactly how the compiler sees it.
- For C/C++, the Analyser component contains 2 sub-components:
- Code Quality Trace tool – Used to monitor the build and generate a compilation database file (e.g: embold-trace make).
To know more about embold-trace tool, refer to this article. - Analyser – Uses the generated compilation database and source files to run the scan and publish results.
- Code Quality Trace tool – Used to monitor the build and generate a compilation database file (e.g: embold-trace make).
To know more about C++ configuration, refer to this article.
To know more about the Recommendation Engine for the beta version, check the link here.
Code Quality behind Proxy
Refer to this article, to know more about BrowserStack Code Quality behind proxy.
Code Quality
Installation Steps:
- There are two ways you can download Code Quality Docker package file:
- Recommended way is to use
wgetcommand as shown below
BROWSERSTACK_CQ_VERSION=1.9.33.0

wget https://v1.embold.io/nfs/BrowserStackCodeQuality_$BROWSERSTACK_CQ_VERSION/Docker/BrowserStackCodeQuality_$BROWSERSTACK_CQ_VERSION.tar.gz
- Alternate way is to Login to Customer Portal and go to Releases section and download from latest release folder.
- Now, Load the docker image using below command
docker load -i BrowserStackCodeQuality_$BROWSERSTACK_CQ_VERSION.tar.gz
New setup
Create the necessary directories and set the appropriate permissions using the following commands
mkdir BrowserStackCodeQuality
cd BrowserStackCodeQuality
mkdir -p logs gamma_data/tmp
chown -R 1001:1001 gamma_data/ logs/
You can either connect to an external PostgreSQL database or use a PostgreSQL Docker container as specified below.
Option 1: Using Docker compose.
If using an external PostgreSQL, skip the db service and configure the database settings in the app service accordingly.
version: '2'
services:
  db:
    image: "postgres:16.3-alpine"
    container_name: BrowserStackCodeQuality-DB
    environment:
      POSTGRES_USER: postgres
      POSTGRES_PASSWORD: postgres
    ports:
     - "5432:5432"
    healthcheck:
      test: ["CMD-SHELL", "pg_isready -U postgres"]
      interval: 10s
      timeout: 5s
      retries: 5
    volumes:
      - /home/${USER}/BrowserStackCodeQuality/gamma_pg_data:/var/lib/postgresql/data
  app:
    image: "browserstack/code-quality:1.9.33.0"
    tty: true
    container_name: BrowserStackCodeQuality
    environment:
    - ACCEPT_EULA=Y
    - gamma_ui_public_host=http://localhost:3000
    - RISK_XMX=-Xmx1024m
    - ANALYSER_XMX=-Xmx6072m
    - PGHOST=db
    - PGPORT=5432
    - PGUSER=postgres
    - PGPASSWORD=postgres
    - GAMMA_DATABASE=gamma
    - ANALYTICS_DATABASE=corona
    depends_on:
      db:
        condition: service_healthy
    deploy:
      resources:
        limits:
          memory: 10G
    ports:
     - "3000:3000"
    volumes:
     - /home/${USER}/BrowserStackCodeQuality/gamma_data:/opt/gamma_data
     - /home/${USER}/BrowserStackCodeQuality/logs:/opt/gamma/logs
     - /home/${USER}/BrowserStackCodeQuality/gamma_data/tmp:/tmp
Option 2: Using Docker
If using an external PostgreSQL, skip the PostgreSQL container and provide the database configuration in the following Docker command.
- Run postgres 16.3 (if not using an external PostgreSQL)
docker run -d \
  --name BrowserStackCodeQuality-DB \
  -e POSTGRES_USER=postgres \
  -e POSTGRES_PASSWORD=postgres \
  -p 5432:5432 \
  -v /home/${USER}/BrowserStackCodeQuality/gamma_pg_data:/var/lib/postgresql/data \
  postgres:16.3-alpine
Get IP address of BrowserStackCodeQuality-DB and use in below docker command in place of DB_HOST
- Run CodeQuality
docker run -d \
  --name BrowserStackCodeQuality \
  -e ACCEPT_EULA=Y \
  -e gamma_ui_public_host=http://YOUR_IP_OR_SERVER:PORT \
  -e RISK_XMX=-Xmx1024m \
  -e ANALYSER_XMX=-Xmx6072m \
  -e PGHOST=DB_HOST \
  -e PGPORT=5432 \
  -e PGUSER=postgres \
  -e PGPASSWORD=postgres \
  -e GAMMA_DATABASE=gamma \
  -e ANALYTICS_DATABASE=corona \
  -p 3000:3000 \
  -v /home/${USER}/BrowserStackCodeQuality/gamma_data:/opt/gamma_data \
  -v /home/${USER}/BrowserStackCodeQuality/logs:/opt/gamma/logs \
  -v /home/${USER}/BrowserStackCodeQuality/gamma_data/tmp:/tmp \
  --user 1001:1001 \
  --read-only \
  browserstack/code-quality:1.9.33.0
Importing Certificates for On-Premise Setup
Step 1: Map the Certificates Directory in the Docker Command
Update the Docker command to map the directory containing the certificates to the required path in the container. Use the following example as a reference: /home/ubuntu//certs:/opt/gamma/certsStep 2: Set the Environment Variable
Add the following environment variable to the Docker command to define the root certificates path: ROOT_CERTS_PATH=/opt/gamma/certsStep 3: Export the Certificate from the On-Premise Webpage
-
- Access the On-Premise Webpage: Open the on-premise setup webpage in your browser.
-
- View Site Details:
Click on the padlock icon in the browser’s address bar and select Site Details.

- View Site Details:
Click on the padlock icon in the browser’s address bar and select Site Details.
-
- Open Certificate Details:
Navigate to Certificate Details and go to the Details tab.

- Open Certificate Details:
Navigate to Certificate Details and go to the Details tab.
-
- Export the Certificate:
Click the Export button, give the certificate a name, and save it. The file will be downloaded as a
.pemfile.
- Export the Certificate:
Click the Export button, give the certificate a name, and save it. The file will be downloaded as a
-
- Step 4: Copy the PEM File to the Mapped Directory
-
- Locate the Downloaded PEM File:
The
.pemfile will be saved in your local system’s default downloads folder or the location you specified.
- Locate the Downloaded PEM File:
The
-
- Move the PEM File to the Mapped Location:
Copy the downloaded
.pemfile to the mapped directory for certificates:
- Move the PEM File to the Mapped Location:
Copy the downloaded
certs folder has the appropriate read/write permissions to be accessed by the container.
Step 5: Restart the Docker Container
Restart the Docker containerUpgrade existing setup
Execute the following steps if you are existing Embold docker version is lower than 1.9.26.0.
Important: RDBMS (Postgres) has been separated from Docker. You can connect to your own RDBMS. Ensure that the Postgres version is >= 13.
Step 1: Backup using Postgres 16
- Create a Backup Directory
- Create a backup directory under the mapped
gamma_datafolder on your host machine. You can find the mapped path in the existing Docker command forgamma_data. For example
- Create a backup directory under the mapped
-v /home/${USER}/BrowserStackCodeQuality/gamma_data:/opt/gamma_data
- Run the following command to create the backup directory:
mkdir gamma_data/backup
- Take a Backup
- Execute the following Docker command to take a backup of the
coronaandgamma
- Execute the following Docker command to take a backup of the
docker exec -it BrowserStackCodeQuality sh -c "pg_dump --no-owner -U postgres corona -f /opt/gamma_data/backup/corona.sql && pg_dump --no-owner -U postgres gamma -f /opt/gamma_data/backup/gamma.sql"
Step 2: Restore the Database. You can connect to your RDBMS or use a Postgres Docker container. Choose one of the following options to connect to the database:
- Option 1: Use an external database
To restore a database on your RDBMS, follow these steps:- Create the databases
- Execute the following command to create the
coronaandgammadatabases. ReplaceYOUR_DB_HOSTandYOUR_DB_USERNAMEwith your actual database host and username.
- Execute the following command to create the
- Create the databases
docker exec -it BrowserStackCodeQuality sh -c 'su - postgres -c "psql -h YOUR_DB_HOST -U YOUR_DB_USERNAME -d postgres -c \"CREATE DATABASE corona;\" && psql -h YOUR_DB_HOST -U YOUR_DB_USERNAME -d postgres -c \"CREATE DATABASE gamma;\""'
- Enter the database password (if prompted).
- Restore the Database
- Execute the following command to restore the
coronaandgammadatabases from backup files. ReplaceYOUR_DB_HOSTandYOUR_DB_USERNAMEwith your actual database host and username.
- Execute the following command to restore the
docker exec -it BrowserStackCodeQuality sh -c 'su - postgres -c "psql -h YOUR_DB_HOST -U YOUR_DB_USERNAME -d corona -f /opt/gamma_data/backup/corona.sql && psql -h YOUR_DB_HOST -U YOUR_DB_USERNAME -d gamma -f /opt/gamma_data/backup/gamma.sql"'
- Enter the database password (if prompted).
- Remove the Existing Embold Container
docker rm -f BrowserStackCodeQuality
- Option 2: Using a Postgres Docker Container
- Run Postgres Container
- Execute the following command to run a Postgres container:
- Run Postgres Container
docker run -d --rm \
  --name BrowserStackCodeQuality-DB \
  -e POSTGRES_USER=postgres \
  -e POSTGRES_PASSWORD=postgres \
  -v /home/${USER}/BrowserStackCodeQuality/gamma_pg_data:/var/lib/postgresql/data \
  -v /home/${USER}/BrowserStackCodeQuality/gamma_data/backup:/backup \
  postgres:16.3-alpine
- Create the databases
- Execute the following command to create the
coronaandgammadatabases:
- Execute the following command to create the
docker exec -it BrowserStackCodeQuality-DB sh -c 'su - postgres -c "psql -U postgres -c \"CREATE DATABASE corona;\" && psql -U postgres -c \"CREATE DATABASE gamma;\""'
- Restore the Database
- Execute the following command to restore the
coronaandgammadatabases:
- Execute the following command to restore the
docker exec -it BrowserStackCodeQuality-DB sh -c 'su - postgres -c "psql -U postgres -d corona -f /backup/corona.sql && psql -U postgres -d gamma -f /backup/gamma.sql"'
- The database restoration is now complete.
- Remove the DB and Existing Embold Container
docker rm -f BrowserStackCodeQuality-DB
docker rm -f BrowserStackCodeQuality
Step 3: Final step: Prepare and Run Docker-Compose
- Execute the following commands to create a temporary directory and set the appropriate permissions:
mkdir gamma_data/tmp
chown -R 1001:1001 gamma_data/ logs/
- Run Docker-Compose
If using an external PostgreSQL, skip thedbservice and configure the database settings in theappservice accordingly.
version: '2'
services:
  db:
    image: "postgres:16.3-alpine"
    container_name: BrowserStackCodeQuality-DB
    environment:
      POSTGRES_USER: postgres
      POSTGRES_PASSWORD: postgres
    ports:
     - "5432:5432"
    healthcheck:
      test: ["CMD-SHELL", "pg_isready -U postgres"]
      interval: 10s
      timeout: 5s
      retries: 5
    volumes:
      - /home/${USER}/BrowserStackCodeQuality/gamma_pg_data:/var/lib/postgresql/data
  app:
    image: "browserstack/code-quality:1.9.33.0"
    tty: true
    container_name: BrowserStackCodeQuality
    environment:
    - ACCEPT_EULA=Y
    - gamma_ui_public_host=http://locahost:3000
    - RISK_XMX=-Xmx1024m
    - ANALYSER_XMX=-Xmx6072m
    - PGHOST=db
    - PGPORT=5432
    - PGUSER=postgres
    - PGPASSWORD=postgres
    - GAMMA_DATABASE=gamma
    - ANALYTICS_DATABASE=corona
    depends_on:
      db:
        condition: service_healthy
    deploy:
      resources:
        limits:
          memory: 10G
    ports:
     - "3000:3000"
    volumes:
     - /home/${USER}/BrowserStackCodeQuality/gamma_data:/opt/gamma_data
     - /home/${USER}/BrowserStackCodeQuality/logs:/opt/gamma/logs
     - /home/${USER}/BrowserStackCodeQuality/gamma_data/tmp:/tmp
Reference diagram
Below illustration helps you understand how the scans work on Code Quality Server.
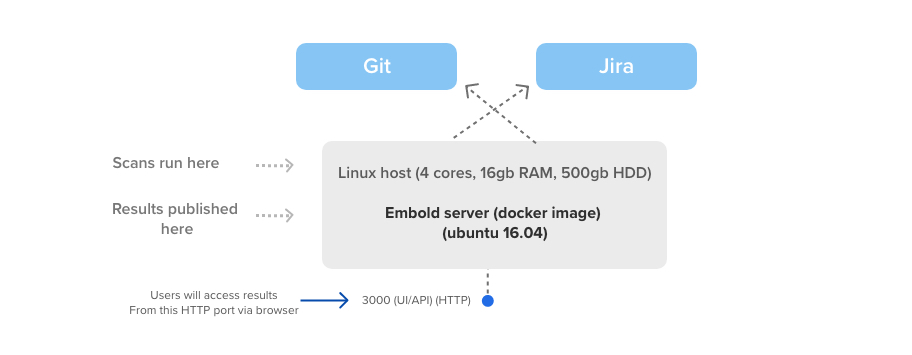
Memory settings
Whenever you want to scan a large repository (above 2 Millions lines of code) remember you need these memory settings. Before you run such scan make sure to tweak few environment values such as -m and ANALYSER_XMX. Note that, such values may not be known upfront when the docker run command is triggered. We recommend values as shown in the table below:
| Lines of code | ANALYSER_XMX | -m | Embold Server/UI Scan (RAM) | Remote Scan (RAM) |
| Upto 1 Million | 6GB | 12GB | 16GB | 16GB |
| Upto 2-10 Millions | 15GB | 30GB | 32GB | 32GB |
The below docker run command is an example where we increased the -m and ANALYSER_XMX values.
docker run -m 30GB -d -p 3000:3000 --name BrowserStackCodeQuality -e gamma_ui_public_host=http://: -e RISK_XMX=-Xmx1024m -e ACCEPT_EULA=Y -e ANALYSER_XMX=-Xmx15360m -v /home/${USER}/BrowserStackCodeQuality/gamma_data:/opt/gamma_data -v /home/${USER}/BrowserStackCodeQuality/gamma_psql_data:/var/lib/postgresql -v /home/${USER}/BrowserStackCodeQuality/logs:/opt/gamma/logs browserstack/code-quality:$BROWSERSTACK_CQ_VERSION
For your information, a significant part of memory allocated using -m to the docker is used by the various processes of Code Quality which includes the UI, Controller Process, and Processes involved in the actual analysis of the source code. Among these processes, the analyzer process a.k.a ANALYSER_XMX uses the maximum memory.
It is also observed in most instances that the ANALYSER_XMX value is proportional to the actual number of Lines Of Code (LOC) scanned for a repository. The ANALYSER_XMX value should not be more than 70% of the allocated value for -m. Also, the environment variables passed to docker such as ANALYSER_XMX and RISK_XMX are mutually exclusive for a given analysis.
For example, a repository with 1 Million lines of code will require a minimum of 6 to 7GB ANALYSER_XMX. Said that, few other factors may impact the ANALYSER_XMX value – like within this repository, there could be a surge of code duplication that will demand the ANALYSER_XMX value to be set to 8GB and the -m value to set to 12GB.
Therefore, a general thumb rules to follow while setting ANALYSER_XMX value are:
- For a repository with less than 1 Million lines of code, that equals 35-37% of the total memory allocated for the container.
- For a repository with less than 3 Millions lines of code, that equals 40-42% of the total memory allocated for the container.
- For a repository with less than 5 Millions lines of code, that equals 50-55% of the total memory allocated for the container.
Note: For C++ repositories to achieve more accuracy we recommend to perform Remote scan with Strict mode. For more details click here
Multi-Threaded Execution
Enhance the analysis process by running the application in multi-threaded mode for faster results.
Ensure your system configuration includes an adequate number of processes to support multi-threaded execution.
Run the Analyzer in Multi-Threaded Mode : By default, the analyzer operates with four threads. For further customisation, set the EMB_ANALYSER_THREADS environment variable on the machine where Embold scan is running. If using Docker, include this variable in the Docker command; for installations, incorporate it into the installer machine.
Run Java Parser in Multi-Threaded Mode : The Java Parser utilizes two threads by default. To adjust the thread count for the Embold Java Parser, set the EMB_PARSER_THREADS environment variable on the machine running Embold Scan. For Docker, integrate this variable into the Docker command; for the installer, incorporate it into the installer machine.
Run CPP Parser in Multi-Threaded Mode : By default CPP Parser operates with single thread. To enable multi-threaded mode, follow these steps:
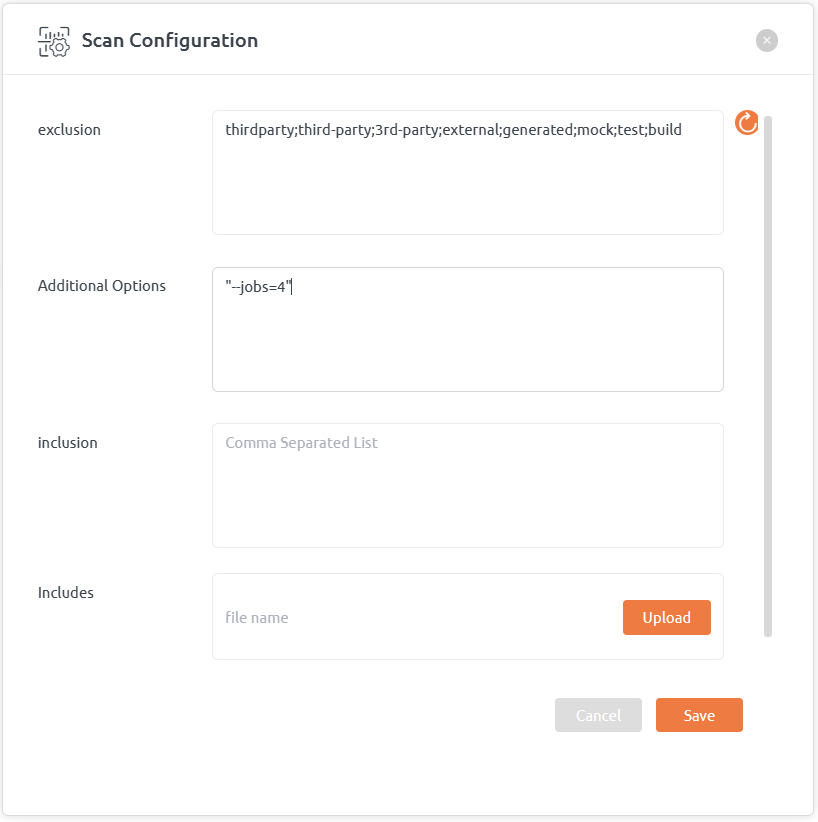
- Go to Projects and on Repository list click on repository context menu (ooo) and then click Scan configuration menu item
- Add “–jobs=[no of multiple process to be launched]” under Additional Options field (for example see below screenshot)
- This settings can also be configured using repository_configuration.json. For that, go to repository context menu (ooo) and click on Download repository configuration and add/edit additional options under settings section (as shown below)
"settings": {
                "additionalOptions": [
                    "--jobs=4"
                ],
                "includePaths": []
            },
Upgrade to newer version
Steps:
- Backup volumes before upgrade:
Before upgrading, we recommend you take a backup of the volumes mounted. This ensures no data is lost during the docker container upgrade process. For example:/home/${USER}/BrowserStackCodeQuality/gamma_data/home/${USER}/BrowserStackCodeQuality/gamma_psql_data - Stop and remove existing running Docker container:
Use thedocker stopanddocker rmcommands to safely remove the existing container as part of the upgrade BrowserStack Code Quality procedure. - Download the latest release:
Log in to the Customer Portal releases section and download the latest BrowserStack Code Quality version as<BROWSERSTACK_CQ_VERSION>.tar.gz. - Load the Docker container:
Use thedocker loadcommand to import the new version of BrowserStack Code Quality:docker load -i BrowserStackCodeQuality_<BROWSERSTACK_CQ_VERSION>.tar.gz - Re-run the Docker container:
Use the following command to re-run the updated container, ensuring all environment variables such as ACCEPT_EULA, RISK_XMX, and ANALYSER_XMX are properly set:docker run -m 12GB -d -p 3000:3000 --name BrowserStackCodeQuality -e ACCEPT_EULA=Y -e gamma_ui_public_host=http://:3000 -e EMB_USE_NATIVE_PYPARSER=TRUE -e RISK_XMX=-Xmx2024m -e ANALYSER_XMX=-Xmx8072m -v /home/${USER}/BrowserStackCodeQuality/gamma_data:/opt/gamma_data -v /home/${USER}/BrowserStackCodeQuality/gamma_psql_data:/var/lib/postgresql -v /home/${USER}/BrowserStackCodeQuality/logs:/opt/gamma/logs browserstack/code-quality:<BROWSERSTACK_CQ_NEW_VERSION>
Important Notes:
- Backups of
gamma_dataandgamma_psql_dataare critical for preventing data loss during the docker upgrade process. - Ensure
docker runuses the updated version<BROWSERSTACK_CQ_NEW_VERSION>. - All environment variables setup should match your previous configuration.
Installation on Windows
Before you begin, please verify that you have a supported version of Windows here.
NOTE: Always use clean Windows VM or clean Bare metal for Installation with min 16GB RAM and 100GB HDD
Pre-installation checks
Following are the prerequisites for installing Code Quality on Windows:
- .NET Framework 4.5 (required for running Code Quality windows installer)
- PowerShell version 5.1
- Google chrome browser
For more information, refer specifications section.
Below are the pre-installation check steps:
.NET Version check:
- Open PowerShell in admin mode and run below command:
(Get-ItemProperty "HKLM:SOFTWAREMicrosoftNET Framework SetupNDPv4Full").Release -ge 378389 - If the above command is “True”, then the default framework is installed.
- If the above command is “False”, then install .NET Framework 4.5 or a newer version.
- .NET Framework 4.5 is the default version.
PowerShell version check:
- Open PowerShell in admin mode and run below command to check the current version:
$PSVersionTable. - If the version is not 5.1, install Windows Management Framework “Win7AndW2K8R2-KB3191566-x64.msu” placed under “..preInstallationsRequiredpowershell5.1 Win7AndW2K8R2-KB3191566-x64.zip”.
- Ensure that PowerShell terminal is closed before installing.
Set PowerShell execution policy:
- After confirming PowerShell version to be 5.1, open PowerShell terminal as administrator and enter the command “Set-ExecutionPolicy RemoteSigned” and choose Yes in the flow.
Dependencies for C# language support:
If the user wants C# language support for Code Quality, ensure to have:
- .NET Core 5.0
- In addition to the pre-requisites, you can install more pre-requisites based on your repository settings.
Note:
- Ensure that the machine on which Code Quality is getting installed has no Node.js installed.
- While installing .net framework, it may ask for user intervention. Choose all the default settings and complete the installation.
Installation steps
Below are the steps to install BrowserStack Code Quality on Windows:
- Download the installer file from your BrowserStack Code Quality Customer Portal > Releases tab > Installers. There will be file with name similar to the following: BrowserStackCodeQuality_windows_1.9.22.0.zip.
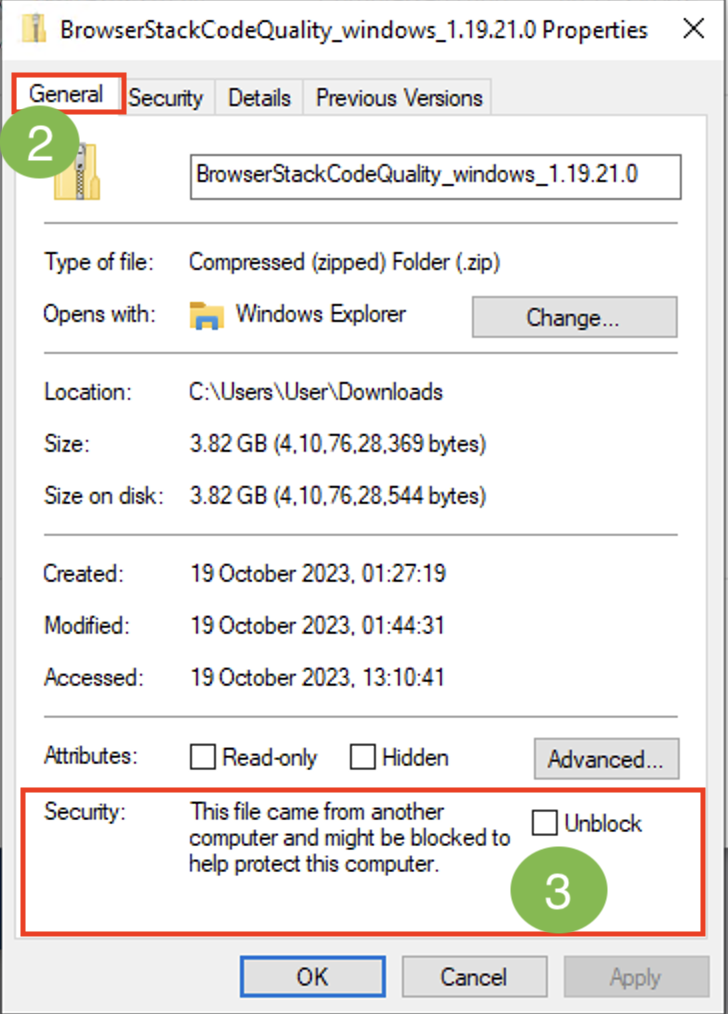
- Right-click the zip folder, click Properties > General tab.
- In the ‘Security‘ section, if the Security button is blocked, unblock it and then proceed with the unzipping of the file.
Note:- If the security button is not blocked, you can directly proceed with the unzipping of the file. - Unzip the BrowserStackCodeQuality_windows_1.9.22.0.zip file.
- Go to setup folder.
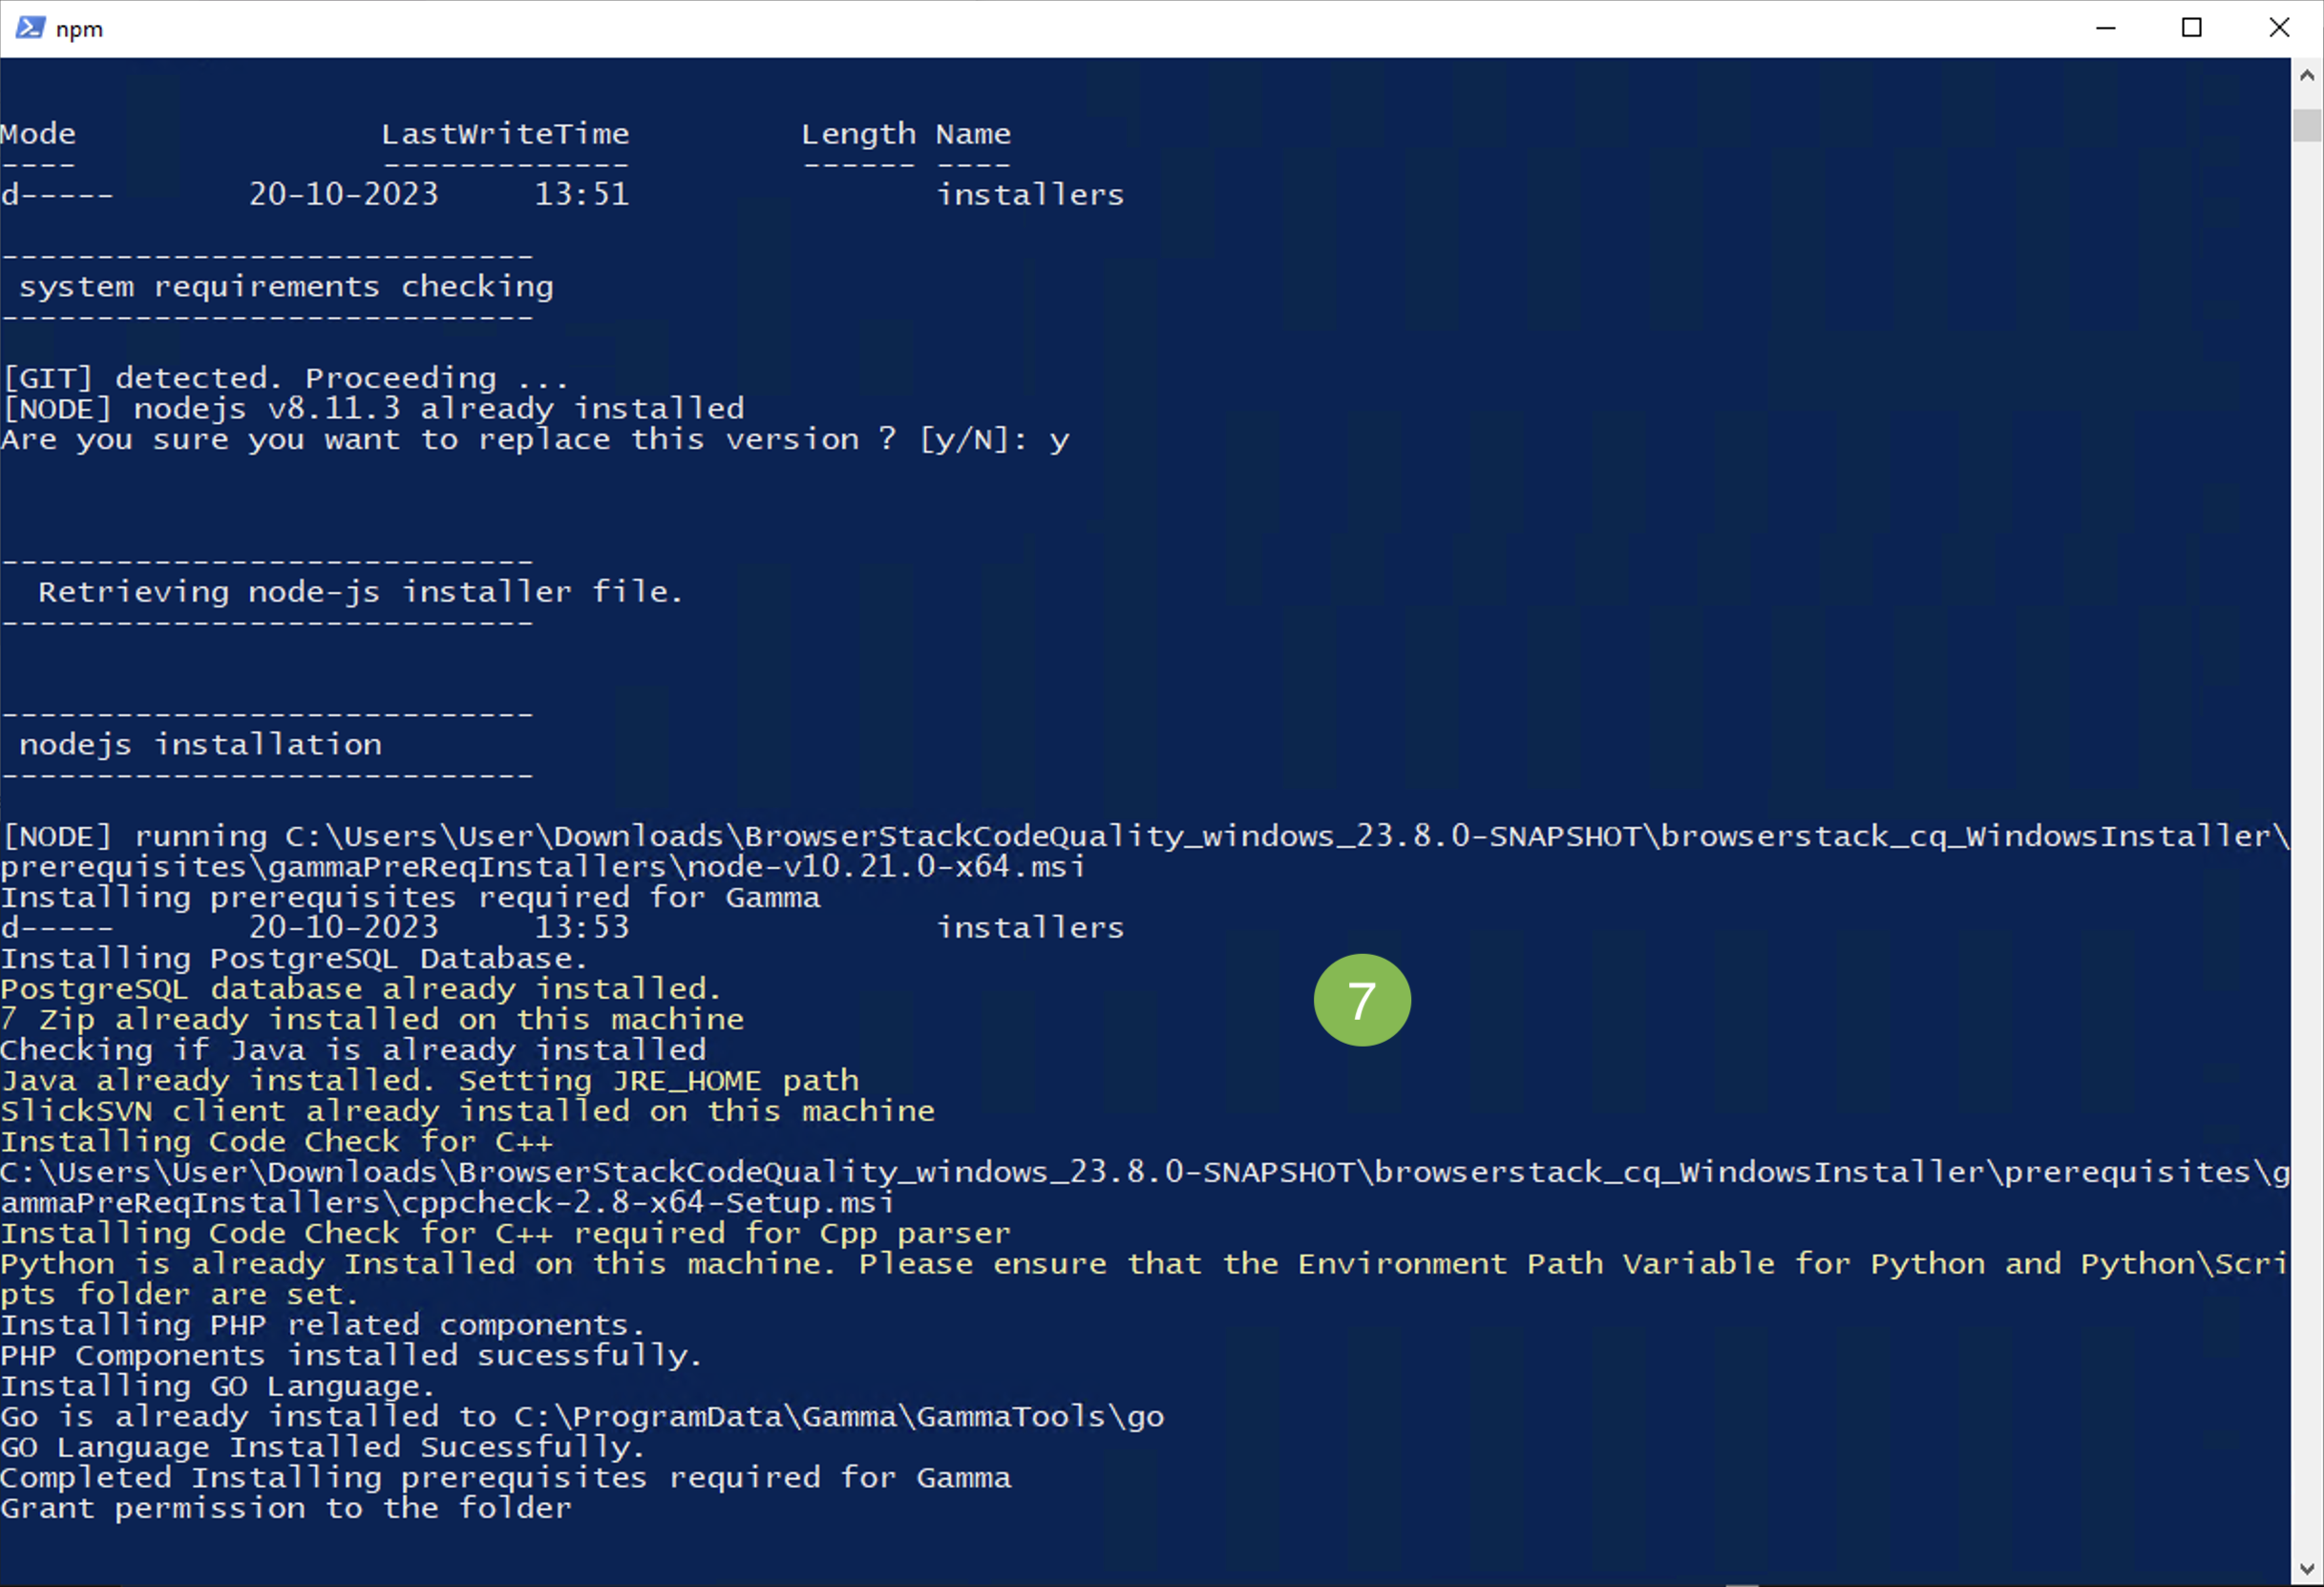
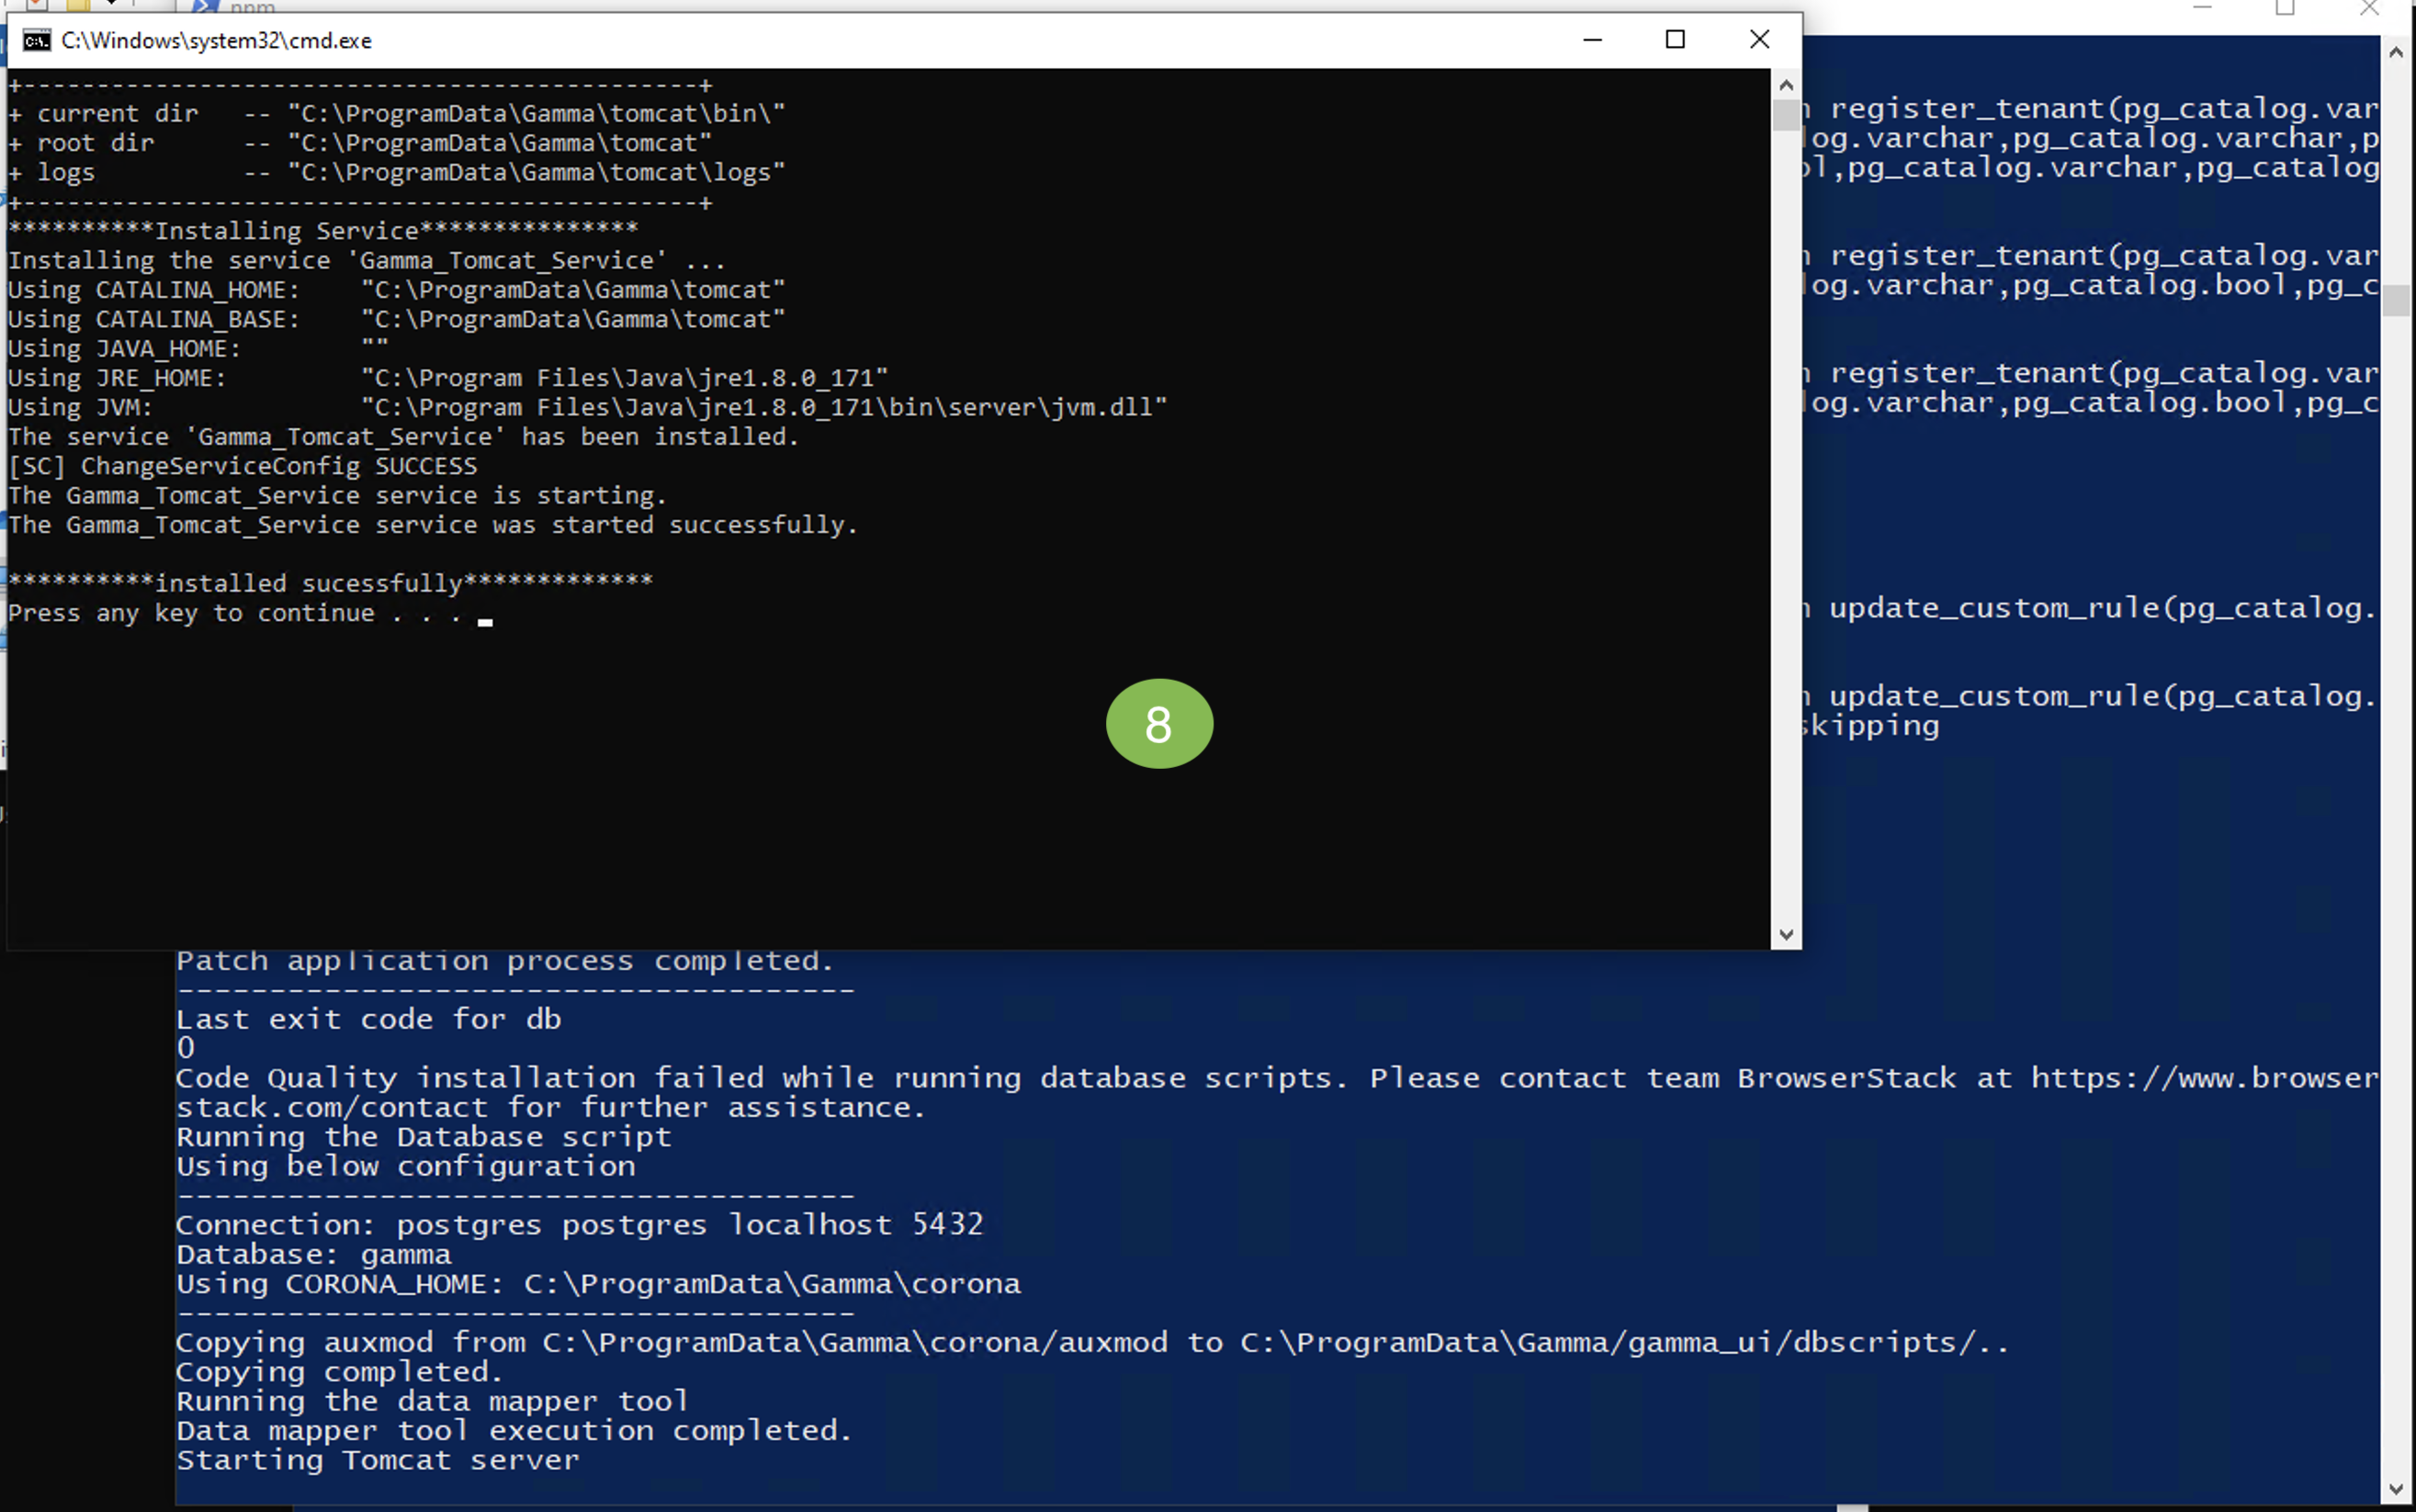
- Open command prompt in admin mode, change the directory (folder) using cd to the path (gammaWindowsInstallersetup) where setup.bat file is located and run the command:
setup.bat - This will install the pre-requisites for the gamma including required frameworks, tools, etc.
The script will set all the required environment variables. - On successful installation, BrowserStack Code Quality login page will be available at localhost:3000.
- Activate BrowserStack Code Quality.

Enable C# Security Checks
- To enable Microsoft Security CodeScan tool for C#, install the following SDKs in order:
- https://download.visualstudio.microsoft.com/download/pr/f92c52da-2ef6-44f2-a296-487f94c2c37a/258dc2e61ff8bec7d90aee3ca1e7d8a3/dotnet-sdk-5.0.406-win-x64.exe
- https://download.visualstudio.microsoft.com/download/pr/962fa33f-e57c-4e8a-abc9-01882ff74e3d/23e11ee6c3da863fa1489f951aa7e75e/dotnet-sdk-3.1.417-win-x64.exe
- Restart all 3 Gamma related services from services.msc
Code Quality behind Proxy
If Code Quality is located behind a proxy, you must provide additional proxy-related information either in the configuration file or the Docker command.
For Docker
This explains how to configure a proxy for remote scans in Embold. Follow the steps below to set up proxy-related environment variables to enable seamless integration.
1. Setting Up Proxy Environment Variables
To enable the use of a proxy for Embold remote scans, set the following environment variables:

Required Proxy Variables
EMB_PROXY_HOST: The hostname of your proxy server (e.g., proxy.example.com).
EMB_PROXY_PORT: The port number used by the proxy server (e.g., 8080).
EMB_PROXY_USERNAME: The username for proxy authentication (if required).
EMB_PROXY_PASSWORD: The password for proxy authentication (if required).
Alternatively, you can use the standard HTTP/HTTPS proxy variables:

HTTP_PROXY: The URL of your HTTP proxy, including authentication details if necessary (e.g., http://proxy_user:password@proxy.example.com:8080).
HTTPS_PROXY: The URL of your HTTPS proxy, including authentication details if necessary (e.g., https://proxy_user:password@proxy.example.com:8080).

2. Excluding Hosts from Proxy
If there are specific hosts or servers that should bypass the proxy, you can configure the following variables:

no_proxy or NO_PROXY: A list of hostnames, IP addresses, or domains that should bypass the proxy. For example:
localhost,127.0.0.1,.example.com
Excluding Multiple Servers
To exclude multiple servers, use the | separator within double quotes. For example:
no_proxy="http://localhost:3000|http://3.72.41.7:3128"

3. Example Configuration
For Unix/Linux Systems
Open your shell configuration file (e.g., .bashrc or .zshrc).

Add the following lines:

export EMB_PROXY_HOST="proxy.example.com"
export EMB_PROXY_PORT="8080"
export EMB_PROXY_USERNAME="proxy_user"
export EMB_PROXY_PASSWORD="password123"

# Alternatively
export HTTP_PROXY="http://proxy_user:password@proxy.example.com:8080"
export HTTPS_PROXY="https://proxy_user:password@proxy.example.com:8080"

# Exclude specific servers
export no_proxy="http://localhost:3000|http://3.72.41.7:3128"

Save the file and reload the configuration:

source ~/.bashrc

For Windows Systems
Open the Environment Variables settings.
Add the required variables under User Variables or System Variables:
For example:
Variable Name: EMB_PROXY_HOST
Variable Value: proxy.example.com
Add no_proxy or NO_PROXY to exclude specific hosts as needed.

4. Verification

To confirm that the proxy settings are applied:

Run a remote scan with Embold and check the logs to verify the proxy connection.
Monitor network traffic to ensure it routes through the specified proxy.For Installer
Modify /etc/default/gamma
1. Change CATALINA_OPTS environment variable with given settings:
export CATALINA_OPTS="-Dhttps.proxyHost=PROXY_IP -Dhttps.proxyPort=PROXY_PORT -Dhttp.proxyHost=PROXY_IP -Dhttp.proxyPort=PROXY_PORT -DGAMMA_ROOT=/opt/gamma -Xmx1024m -Djava.awt.headless=true -Djava.library.path=/usr/lib/x86_64-linux-gnu/jni/:/usr/lib64/"2. Also add new environment variables as below:
export https_proxy=http://PROXY_IP:PROXY_PORT
export http_proxy=http://PROXY_IP:PROXY_PORT
export no_proxy='127.0.0.1,localhost'Backup & Restore
This guide will help you back up and restore your BrowserStack Code Quality data, including source code, scans, and prerequisites.
Prerequisites for database backup
- The BrowserStack Code Quality version on the source and destination machines must be the same.
- Stop the BrowserStack Code Quality service on the destination machine.
- Administrative privileges are required.
- The script assumes the default database names are
coronaandgamma. - If the backup/restore is performed on a remote machine, share or mount the backup directory to make it accessible.
- Pre-create a backup directory and grant write permissions.
- Know the BrowserStack Code Quality installation directory for backup/restore.
- On Linux, disable password authentication for remote restoration.
Backup & restore on Windows
This will include the information on database backup and restoration of the Windows operating system.
Database backup
Database Backup
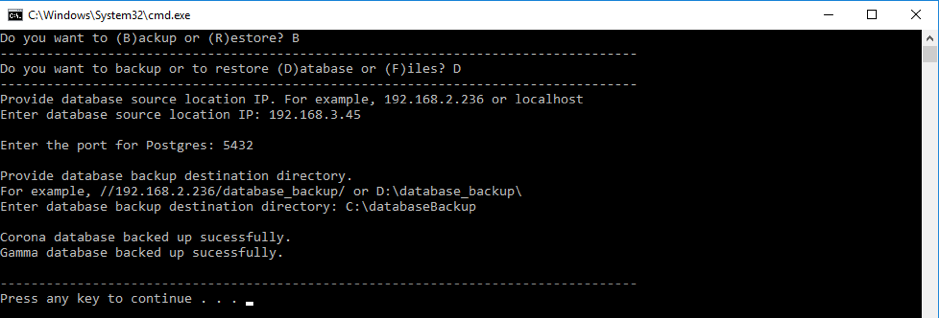
- Locate the batch file at:
C:\ProgramData\Gamma\gamma_ui\dbscripts\scripts\backup_restore.bat. - Execute the file. Follow the prompts in the command prompt to back up the database.
B. Files backup on windows
- Use the same batch file:
C:\ProgramData\Gamma\gamma_ui\dbscripts\scripts\backup_restore.bat. - Follow the prompts to back up source files and logs.
- Provide a destination directory for logs.


Database restoration
Use the batch file:C:\ProgramData\Gamma\gamma_ui\dbscripts\scripts\backup_restore.bat.Follow the prompts and provide the SQL files generated during the backup process.

Files Restoration
- Use the same batch file:
C:\ProgramData\Gamma\gamma_ui\dbscripts\scripts\backup_restore.bat. - Provide the paths for source files and logs used during the backup


Backup & restore Database on docker
1. Database Backup and Restore
You have two options for backing up your database: an UI-based approach and a manual command-line procedure.
Option A: Backup via the Code Quality UI
This is the recommended method for creating regular, scheduled backups.
- Start Your Code Quality Instance: Ensure your Docker container is running with the correct volume mappings. The most important mapping is for the data directory, which is where your backups will be stored.
- Volume Mapping: Backups are saved to the
/opt/gamma_datadirectory inside the Docker container. This directory is mapped to a location on your host machine (e.g.,/home/${USER}/BrowserStackCodeQuality/gamma_data) so the files are easily accessible. - Explanation: The
/home/${USER}/BrowserStackCodeQuality/gamma_data:/opt/gamma_data
part of the command maps the/opt/gamma_datadirectory inside the container to/home/${USER}/BrowserStackCodeQuality/gamma_dataon your host machine. This is where your backup files will be saved.
- Volume Mapping: Backups are saved to the
- Enable and Schedule in the UI:
- Log in to your Code Quality instance.
- Go to Settings.
- Look for the Backup section.
- Enable the backup feature and set a schedule (e.g., daily, weekly).
- Retrieve the Backup Files
After the scheduled backup runs, navigate to the host directory you mapped in the Docker command (e.g.,/home/${USER}/BrowserStackCodeQuality/gamma_data.sqlfiles. For restoration, you will need to locate the files with the same timestamp, for example:embold_database_backup_07092023_102900.tar.gz

Option B: Manual Backup via the Command-line Script
This method is for a one-time, on-demand backup.
- Run the Backup Script
Open your terminal on your host machine and run the following command, replacing<container_name_or_id>with your actual container name or ID.docker exec -it <container_name_or_id> /opt/gamma/gamma_ui/dbscripts/scripts/backup_restore.sh
Note: Thedocker execcommand allows you to execute commands inside a running container without entering an interactive shell.to get a shell inside the running container. - Follow the On-Screen Prompts:
- The script will display a menu. You must enter the correct letters to proceed.
- First Prompt:
Enter choice (B/R):- Type B for Backup and press Enter.
- Second Prompt:
Enter choice (D/F):- Type D for Database and press Enter.
- Confirm Backup Location:
- The script will show you the progress and confirm the backup location.
- Expected Output:
→Backing up databases to/opt/gamma_data/backup/db ... Backup completed! Files saved in /opt/gamma_data/backup/db- Your backup files are now saved inside the container at
/opt/gamma_data/backup/db. You can retrieve them from the mapped host directory.

3. Database Restore
This process uses a command-line script to restore the database from a backup.
⚠️ Warning: This process will overwrite your current database. It is strongly recommended to perform a new backup of your current database before proceeding with a restore.
Prerequisites
The restore script expects the backup files to be located in a specific directory: /opt/gamma_data/backup/db inside the container. Since this location is mapped to your host machine, you must ensure the backup files you want to restore are present in your host’s mapped directory (/home/${USER}/BrowserStackCodeQuality/gamma_data/backup/db
- If you manually created a backup, it should already be in this location.
- If you have a backup from a different source, you must place the
.sqlbackup files into the/home/${USER}/BrowserStackCodeQuality/gamma_data/backup/db - If your backup file is in
.tar.gzformat (from a UI-based backup), you must first extract the.sqlfiles before placing them in the restore directory.
Run the Restore Script
Open your terminal on your host machine and run the following command, replacing <container_name_or_id> with your actual container name or ID.docker exec -it <container_name_or_id> /opt/gamma/gamma_ui/dbscripts/scripts/backup_restore.sh
Step 3: Follow the On-Screen Prompts
- First Prompt:
Enter choice (B/R):- Type R for Restore and press Enter.
- Second Prompt:
Enter choice (D/F):- Type D for Database and press Enter.
- File Selection: The script will automatically detect the
.sqlfiles in the restore directory and list them.- Expected Output:Available backups in
/opt/gamma_data/backup/db: 1)gamma_database_backup_07092023_102900.sql2)corona_database_backup_07092023_102900.sqlSelect Gamma backup file: - Enter the number: Type the number corresponding to the
gammafile (2 in this example) and press Enter. - Enter the number: Type the number corresponding to the
coronafile (1 in this example) and press Enter.
- Expected Output:Available backups in
- Confirm Restore: The script will begin the restore process.
- Expected Output:→ Restoring databases… Database restore completed!

Backup and Restore Files on docker
1. Backup Files
Follow these steps to create a backup of your files.
- Run the Command: Open your terminal on your host machine and run the following command, replacing
<container_name_or_id>with your actual Docker container identifier.docker exec -it <container_name_or_id> /opt/gamma/gamma_ui/dbscripts/scripts/backup_restore.sh - Follow the Prompts:
The script will display a menu. You must enter the correct letters to proceed.- First Prompt:
Enter choice (B/R): - Type B for Backup and press Enter.
- Second Prompt:
Enter choice (D/F): - Type F for File and press Enter.
- First Prompt:
Result: The script will confirm the backup is in progress and then announce its completion. Your backup will be a .tar.gz file saved in the mapped host directory (e.g., /home/${USER}/BrowserStackCodeQuality/gamma_data/backup/files).

2. Restore Files
Warning: This process will overwrite your current files. When prompted with “Directory /opt/gamma_data/tenants already exists. Backup before replacing? (y/n):”, entering y is highly recommended to create a new backup of your current files before proceeding with the restore.
- Prerequisites: The
.tar.gzbackup file you want to restore must be in your mapped host directory:/home/${USER}/BrowserStackCodeQuality/gamma_data:/opt/gamma_data/backup/files. - Run the Command: Open your terminal on your host machine and run the following command, replacing
<container_name_or_id>with your actual Docker container identifier.docker exec -it <container_name_or_id> /opt/gamma/gamma_ui/dbscripts/scripts/backup_restore.sh - Follow the Prompts:
The script will display a menu. You must enter the correct letters to proceed.- First Prompt:
Enter choice (B/R): - Type R for Restore and press Enter.
- Second Prompt:
Enter choice (D/F): - TypeF for files and press Enter.
- The script will ask: “Directory /opt/gamma_data/tenants already exists. Backup before replacing? (y/n):”.
- Enter
yto have the script create a backup of your current files automatically before the restore begins. This is highly recommended. - Enter
nto proceed with the restore without creating a new backup.
- Enter
- First Prompt:

C++ Configuration
For setting up an environment for C++, you can perform configuration steps for installing files, databases and so on.
C++ Strict Mode
In strict mode, CXXParser uses a compilation database to parse files. Compilation database contains actual compile commands and options used to compile source files in a project which helps CXXParser in accurate parsing. Compilation database can be generated using build tools such as cmake, make, waf, scons, etc.
Embold Trace
Introduction
BrowserStack Code Quality uses Compilation Database (CDB) to scan C/C++ repository in strict mode. BrowserStack Code Quality provides a tool ‘embold-trace’ to generate CDB from build process. BrowserStack Code Quality-trace tool facilitates users to configure which compilers to intercept during build. It then intercepts build process and generates CDB based on configured compilers.
Supported Platforms
Before you begin, please verify that you have a supported version of operating systems here.
Prerequisites
- Linux
strace: A tool for debugging and troubleshooting programs in Unix-like operating systems such as Linux.
Read more about strace here. - Installation of strace
For Ubuntu→$ sudo apt-get install strace
For CentOS/Red Hat→$ sudo yum install strace
How to use
- To run the embold-trace, run the below command:
$ embold-trace [embold-trace-options] {your build command} [build-options] - Use `
--help` to know more about the embold-trace options.
MSBuild on Windows
BrowserStack Code Quality-trace has two modes of operation for tracing MSBuild projects:
- Using .tlog files→Uses MSBuild generated tracker log files of the form CL.command.1.tlog to generate CDB
This mode can be enabled using -t option of embold-trace
$embold-trace-tmsbuild project.sln - Trace files → Uses intermediate trace files to generate CDB.
This is the default mode of operation
Output Directory
Embold-trace supports generating CDB in custom directory with option -o $ embold-trace -o {custom/directory}
Configure embold-trace
BrowserStack Code Quality-trace uses json configuration files to configure compilers to intercept. There are two types of configuration files.
1. Top-level configuration file:
This file list down the compilers names to intercept and corresponding translation file name (excluding extension). BrowserStack Code Quality-trace provides compiler configuration for all the standard compilers.
The default name is ’embold-trace-default.json’
- Source Extensions
The default configuration file lists supported extensions for C/C++ source files. Users should add the extension which needs to be supported to this configuration file. (if not already present)
- Translation file:
It contains the corresponding compiler options to specify include directory, include file and define macro.
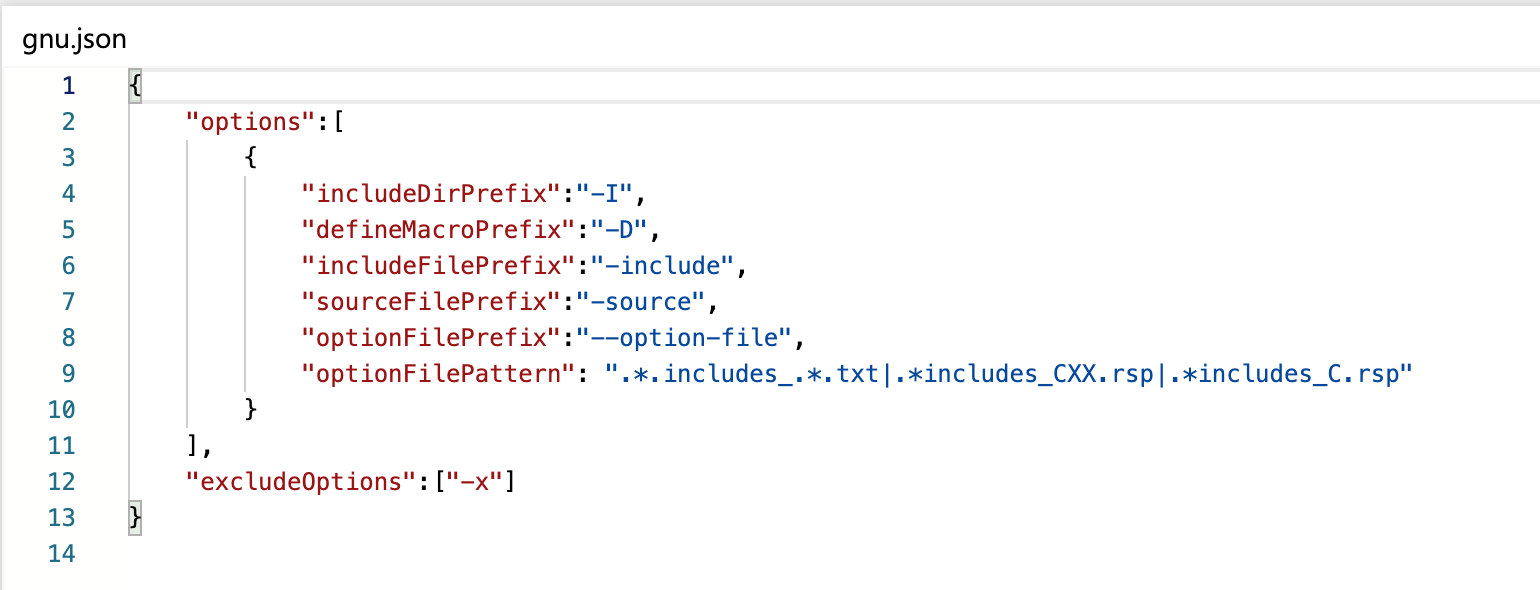
Key-Value description in translation json as follows :
| Key | Value | Description | Example |
|---|---|---|---|
| includeDirPrefix | Option used to specify include directory | -I (GNU Family) | -I (GNU Family) |
| defineMacroPrefix | Option used to define macro | -D (GNU Family) | -D (GNU Family) |
| includeFilePrefix | Option used to include single file during compilation | -include (GNU Family) | -include (GNU Family) |
| sourceFilePrefix | Prefix used to specify source files in compile command | Prefix used to specify source files in compile command. Green Hills Compiler uses flag --source to specify source file in compile command. Example: $ ease850 --source=abc.cpp | --source (GH Compiler) |
| optionFilePrefix | Prefix used to specify build system options file. Options file contains compiler options for include directory, define macro etc. | Instead of directly specifying options like -I, -D in compile commands, some compilers or build systems uses a special file called option file which contains compiler flags. This file is then provided in compile command using a prefix. The value of this key is that prefix. Example: $ cctc --option-file=option-file.txt abc.cpp | --option-file (Tasking Tri-core) |
| optionFilePattern | A pattern to specify build system options file. Each build system or compiler has different name format for options file. So, a regex should be specified as value. | Option files can also be specified using pattern instead of prefix. Example: CMake build system generates response files whose names are like includes_CXX.rsp for C++ compilation and includes_C.rsp for C compilation. These files contain includes and define options required for compilation. And these response files are supplied usually using ‘@’ character at the start but not necessarily. Example: "command": "g++ @CMakeFiles/TestProject/includes_C.rsp -o CMakeFiles\ TestProject\test.o -c C:\TestProject\test.c"A regex which match these file names should be provided as value of optionFilePattern in translation file. Then, if embold-trace finds such file pattern in compile command, then it replace the content of the option file in compile command for Embold to parse correctly. | .*includes_CXX.rsp (CMake Build) |
Where to find
By default, all the provided configuration files (top-level and translation) are present in the directory where embold-trace binary is present. Any new translation file should also be added to the same directory.
However, you can keep all the configuration files in a separate directory. In this case, the top-level configuration file path should be given as input to embold-trace while invocation using option “-c”$ embold-trace -c
2. Adding Non-Standard Compiler Name
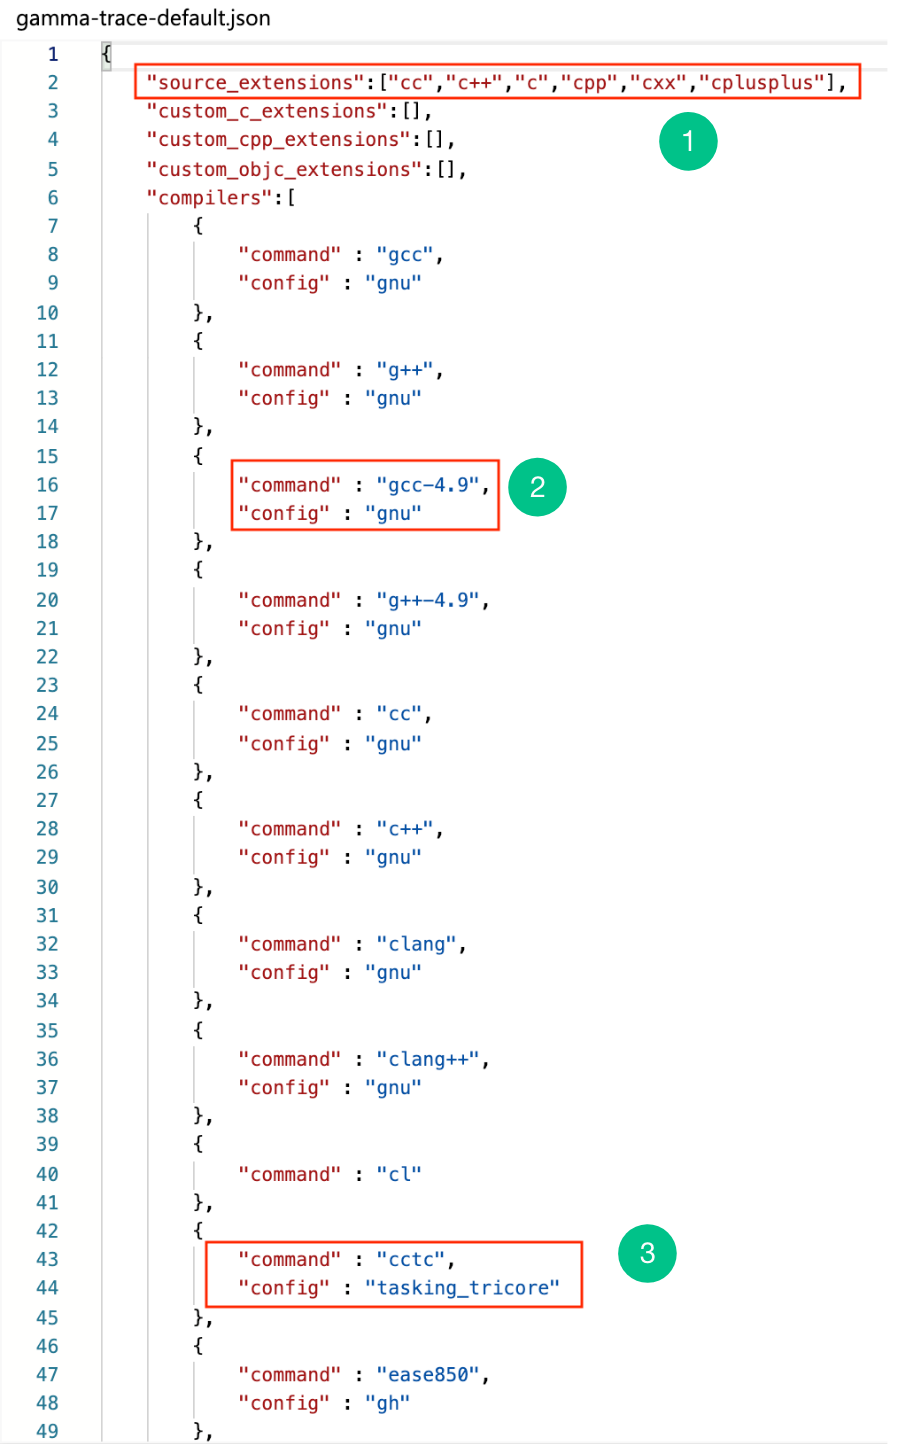
If you have a standard compiler from the above list but a non-standard name, you must edit the default configuration file.
Example:
If a GCC compiler 4.9 is installed and compiler name is ‘gcc-4.9’
Then, add an entry to top-level configuration file.
Adding Unsupported Compiler
If your compiler is name is not found in top-level configuration file and it is not a standard compiler like GCC or Clang, then that compiler is non supported by embold-trace by default.
Supporting a non-supported compiler involves two steps:
- Add an entry in the top-level configuration file
- Add corresponding translation file
3. Add an entry in the top-level configuration file
An entry must be added to top-level configuration file for this compiler name and corresponding translation file name (excluding extension).
Example:
Suppose your new compiler name is ‘cctc’ which takes following options
“-inc” – to include directory
“-def” – to defining macro
“-ifile” – to include a file during compilation
Where, tasking_tricore is a JSON translation file named tasking_tricore .json in the same directory as top-level configuration file.
- tasking_tricore json file will look like below:
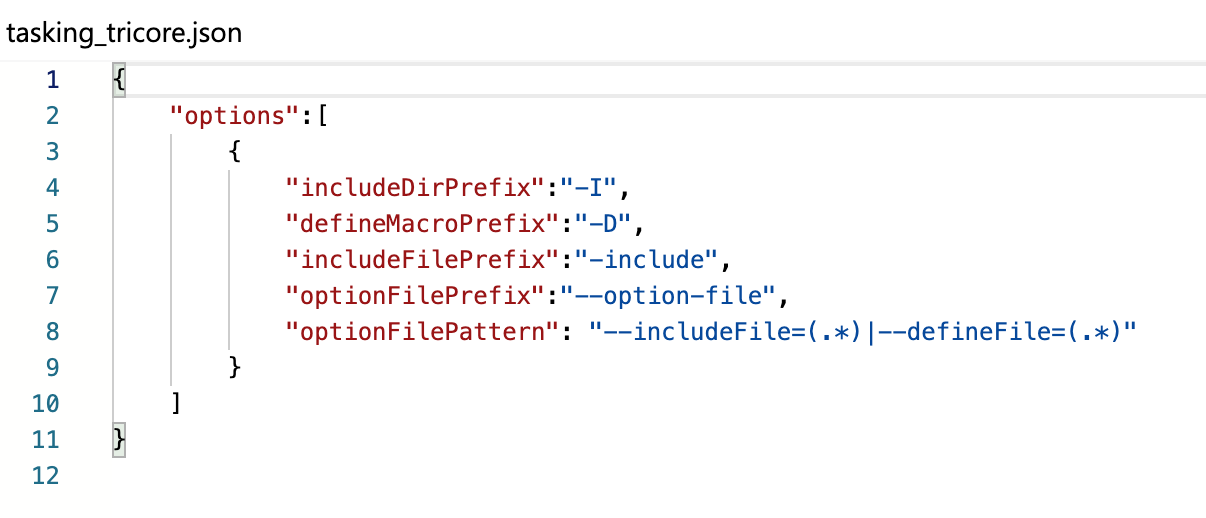
Suppose the new compiler takes includeFile of the form @test/.includeDirs_c23dewff34.txt Hence, the regex provided is “.*.includesDirs_.*.txt”
Supported Compilers
| Compiler | Compiler name | Translation config name |
|---|---|---|
| GCC | gcc, g++, cc, c++, clang | gnu.json |
| Clang | clang, clang++ | gnu.json |
| Green Hills (GH) | ease850 | gh.json |
| Tasking Tri-core | cctc | tasking_tricore.json |
| MSBuild | cctc | tasking_tricore.json |
Locate Compilation Database
After the build is finished successfully, the Compilation Database is generated in the current working directory where the build is run. A file named compile_command.json is the CDB. If the embold-trace successfully generates CDB, a log message will be printed displaying the number of compile entries in CDB.
Locate Configuration Files
By default, all the provided configuration files (top-level and translation) are present in the directory where the embold-trace binary is present. Any new translation file should also be added to the same directory.
However, you can keep all the configuration files in a separate directory. In this case, the top-level configuration file path should be given as input to embold-trace while invocation using option “–c”
$ embold-trace -c {top/level/config/file/path} {your build command} [build-options]
Configuring Unknown Compiler
Configuring embold-trace for an unknown compiler is an iterative process.
Steps to configure
- Run build using embold-trace (Check How to use section)
- After the build, embold-trace will print number of non-configured executable and log all the entries in a text file embold-trace-unknown-exe.txt. This file will be createdin current working directory. Not all the executable are compilers so user need to identify which ones are the compilers.
- If you found your compiler in non-configured list then go to next step else configuration is done no further action is needed
- Create a translation file for your compiler
- Add compiler name and translation file name entry to embold-trace-default.json
- Run embold-trace with trace file as input (No need to run build again)
- Go to step 2
Example: Configuring g++
Assumption: No compilers are configured.
Empty embold-trace-default.json
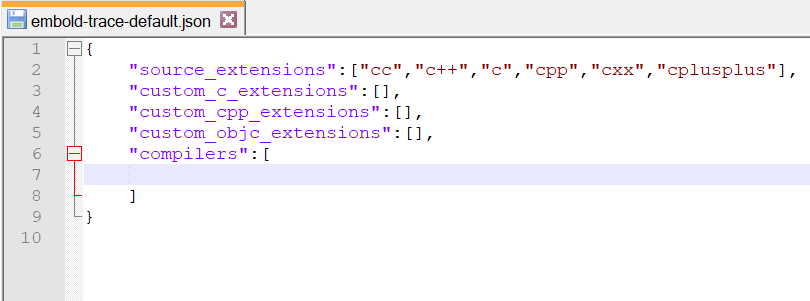
Our sample repository is cppcheck. We will build the repository using embold-trace and configure compiler g++ and create compilation database.
Step 1: Build repository using embold-trace

Step 2: Build output

As can be seen from above image, embold-trace intermediate trace file path is C:\Users\Hemant\AppData\Local\Temp\embold-trace-log_1590487077. Non-configured executable is 4 and they ate written to C:\Workspace\repos\cppcheck\build_make\embold-trace-unknown-exe.txt. Also, no commands have been intercepted as no compilers are configured.
Step 3: Inspect the contents of C:\Workspace\repos\cppcheck\build_make\embold-trace-unknown-exe.txt

There are 4 entries in unknown executable list. Not all executable are compilers only g++ is. So we will go to next step and configure g++.
Step 4: Create a translation file gnu.json (filename can be anything) for g++ compilers
For all GNU family compilers like gcc, g++
includeDirPrefix → -I
defineMacroPrefix → -D
includeFilePrefix → -include
So we will create gnu.json like this

Step 5: Add compiler name (g++) and translation file name (gnu) entry to embold-trace-default.json
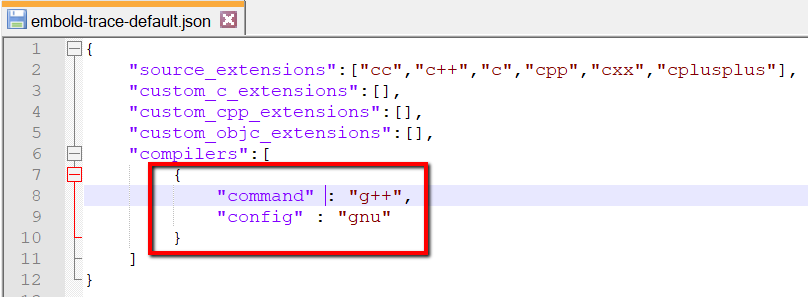
Step 6: Rerun embold-trace with a new configuration and trace file as input

This time the compilation database is generated and non-configured executable count is reduced by 1 as we have configured g++ compiler. Also we didn’t run the build again. Contents of C:\Workspace\repos\cppcheck\build_make\embold-trace-unknown-exe.txt

There is no entry for g++. So g++ is configured correctly. Other executable are not required to be configured. So embold-trace configuration is complete and we got valid compilation database.

Step 7: No need to go to step 2
Likewise, we can configure any possible compiler iteratively
Non-configured Executable file format
Its a text file which provides hints to user regarding probable compilers in build. It contains unique executable path per line. Each line is further divided into 3 parts separated by semicolon. Meaning of each part is explained in below image.

As you can see, the first thing user need to check is whether the executable is compiler or not is by inspecting the second part, configure all* executable with “C“ first as they probably are compilers. And executable with most occurrences and “N“ might be custom compiler but they are can only be identified by build engineers.
*Some compiler executable internally also invokes another executable in that case we may ignore it like cc1plus. g++ internally invokes cc1plus.
Custom Source Extensions
By default, embold-trace supports following C/C++ extensions
“cc”,”c++”,”c”,”cpp”,”cxx”,”cplusplus”
However, user can add custom extensions like this
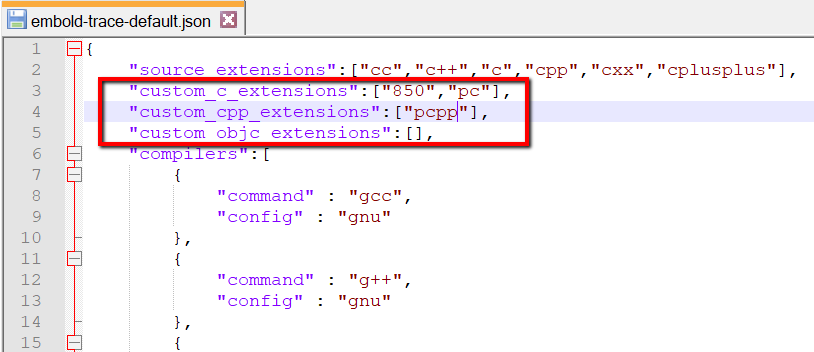
Here ‘850’ & ‘pc’ are custom C extensions and 'pcpp' is custom C++ extension
Running analysis in strict mode
Set up your remote Embold instance. This is where your analysis results will be published. Follow the steps to set up remote analysis here.
- Follow the steps to set up remote scan
- If you wish to create a separate build folder for running trace-utility (intercept-build), you should use the –cdb additional option while running the scan.
The compile_commands.json will be created inside your build directory and not in the base directory of your source folder. Since, the scanner looks for the compile_commands.json in the base directory by default, use the –cdb option to specify the directory where your compile_commands.json is located. - In “settings” section, under “additionalOptions” set the directory where compilation database resides.
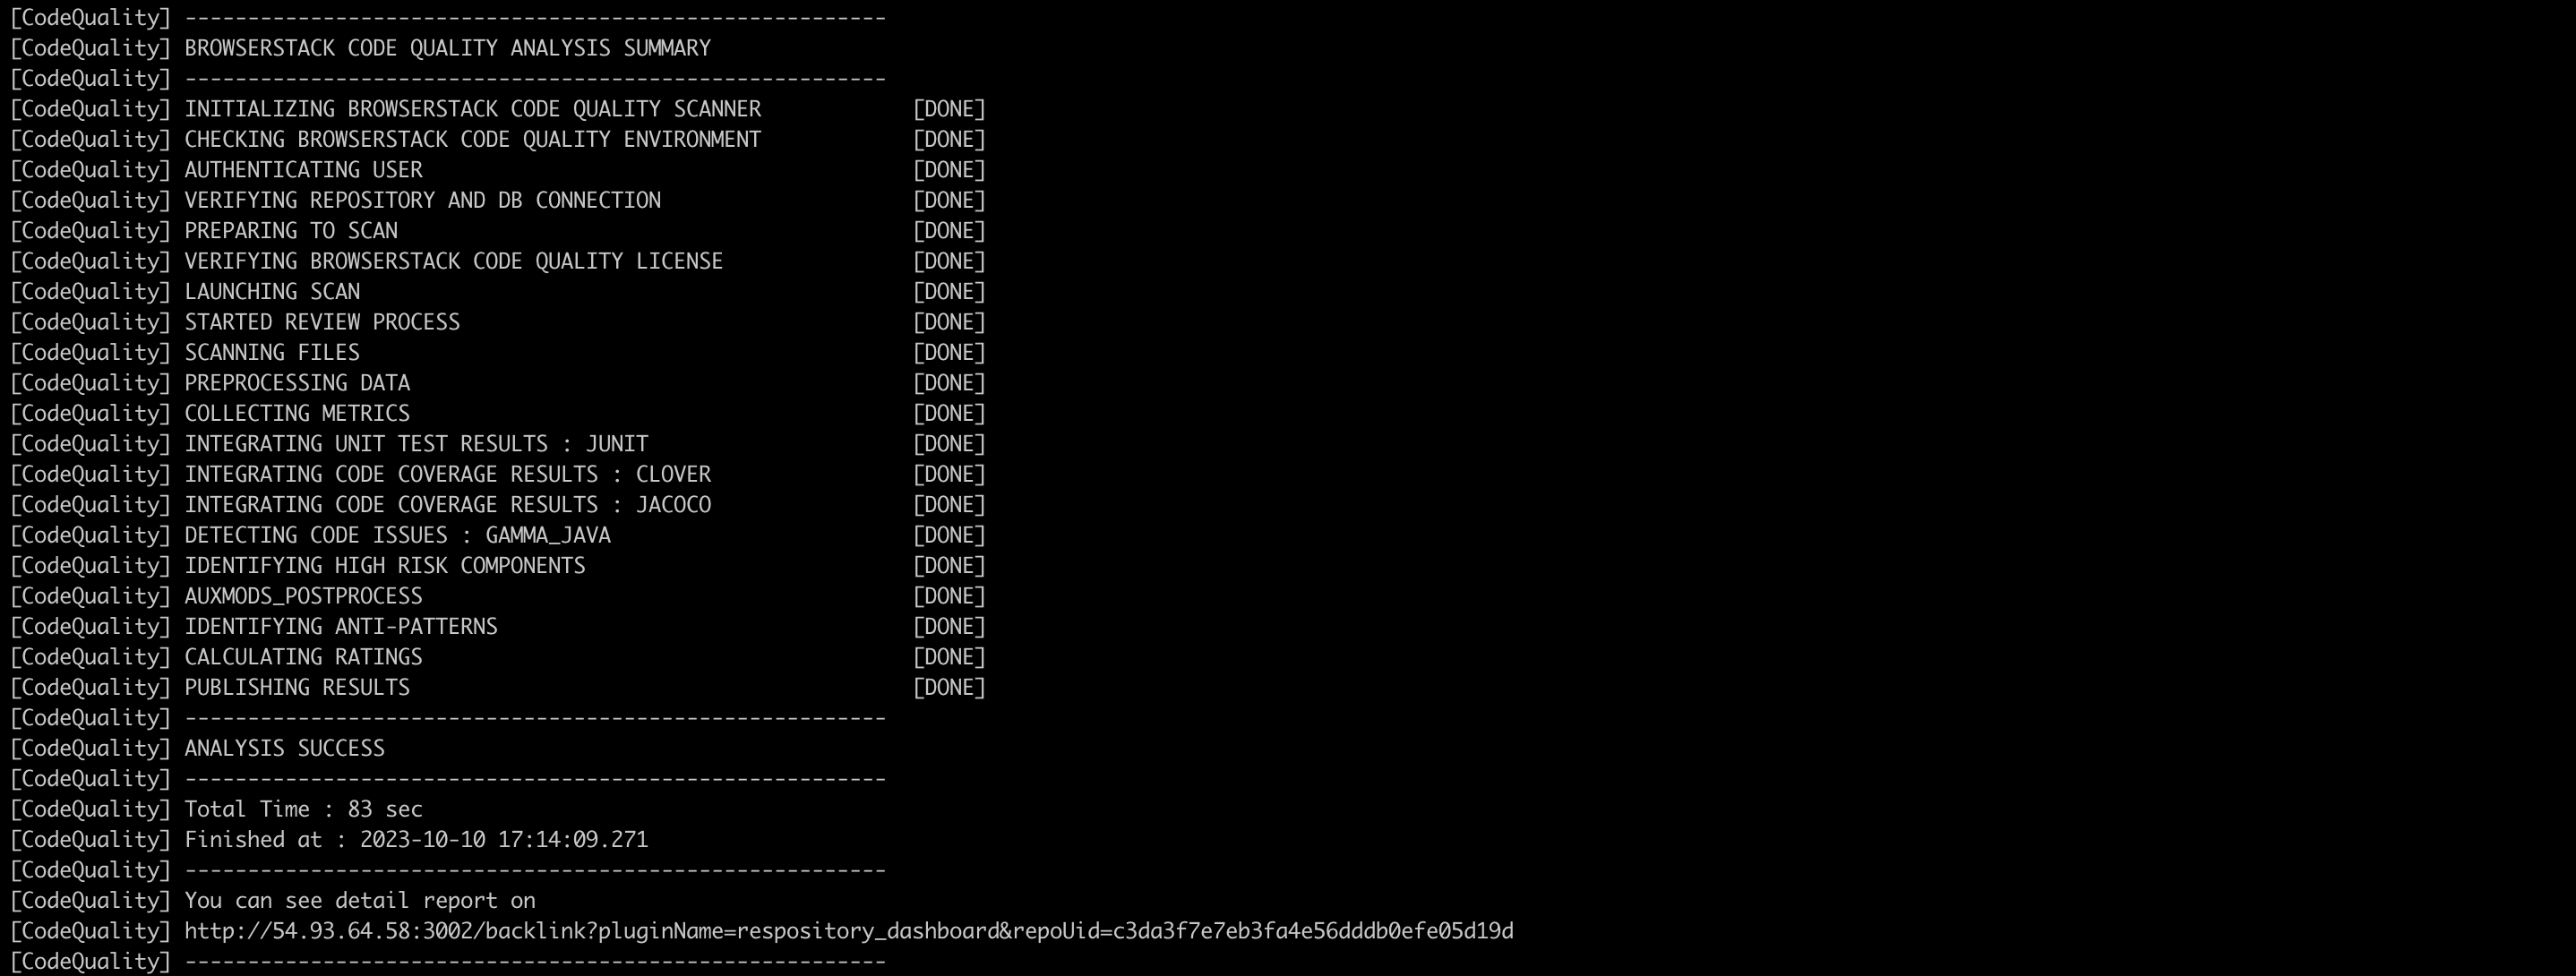
Example: –cdb= - If the scan is successful you should see “ANALYSIS SUCCESS”. On your build machine, the last two log messages indicate that the remote analysis was successful.
- On your remote Embold instance, you will be able to see published results.
C++ Fuzzy Mode
If any included file is not found in the source directory, cxxparser will throw a warning message which contains the location of missing include. Accuracy of the parser can be improved by providing the path to the directories which contain the missing files.
Improving accuracy in fuzzy mode
Steps to navigate to Scan Configuration Option:
- Click on Projects option on the left side navigation pane.
- Inside your project, click on a repository and then click on three dots “…” on the top right corner. Select the Scan configuration option.
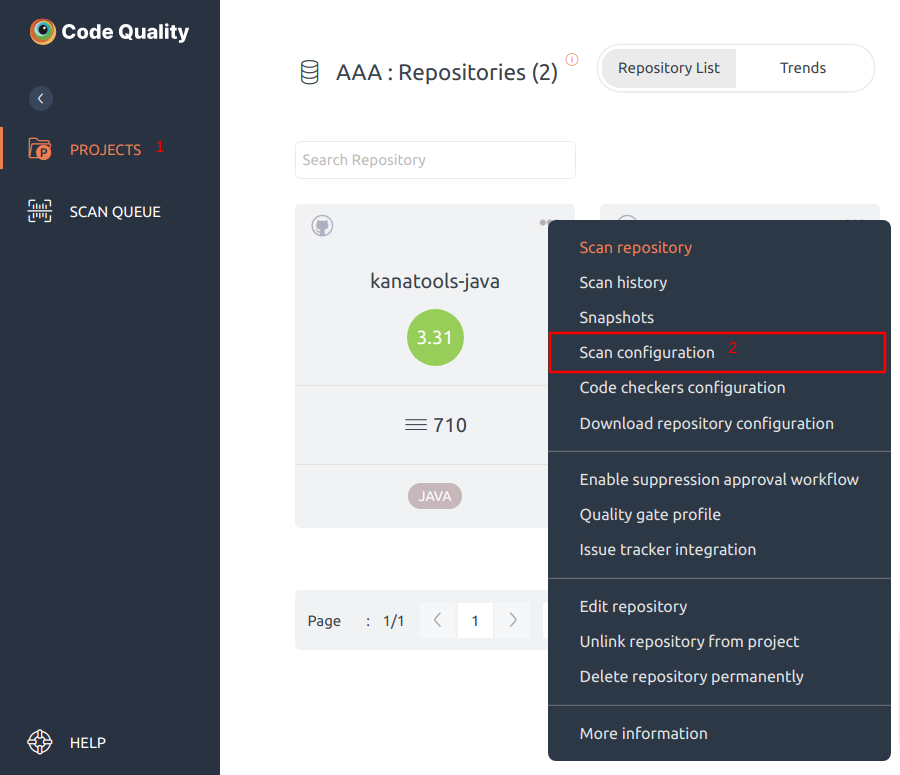
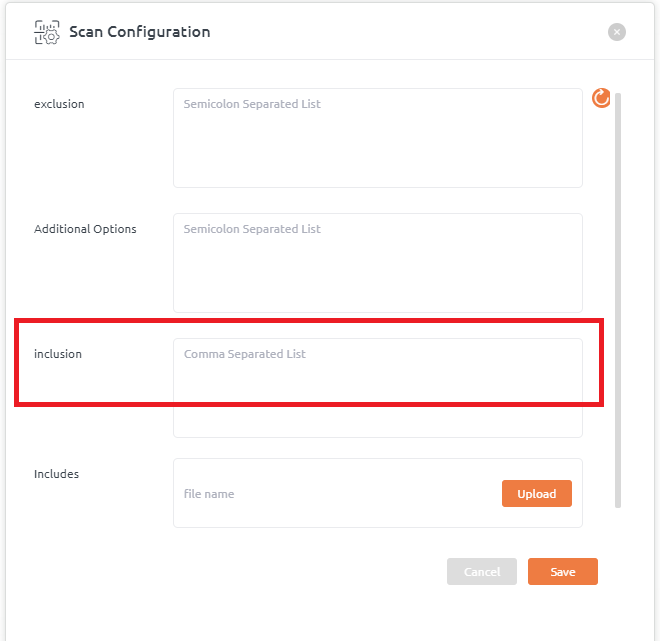
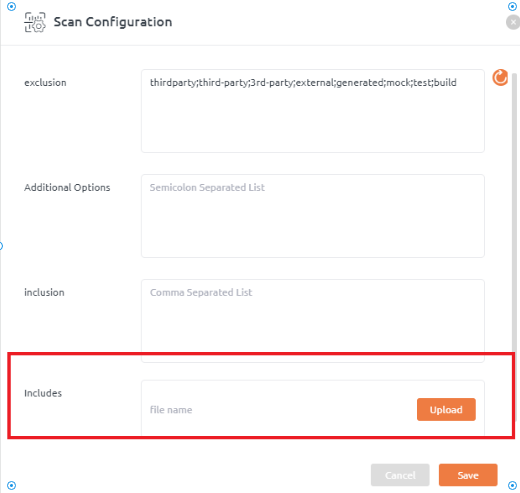
Scan Configuration window consists of:
- Exclusion
- Additional Options
- Inclusion
- Includes
Exclusion:
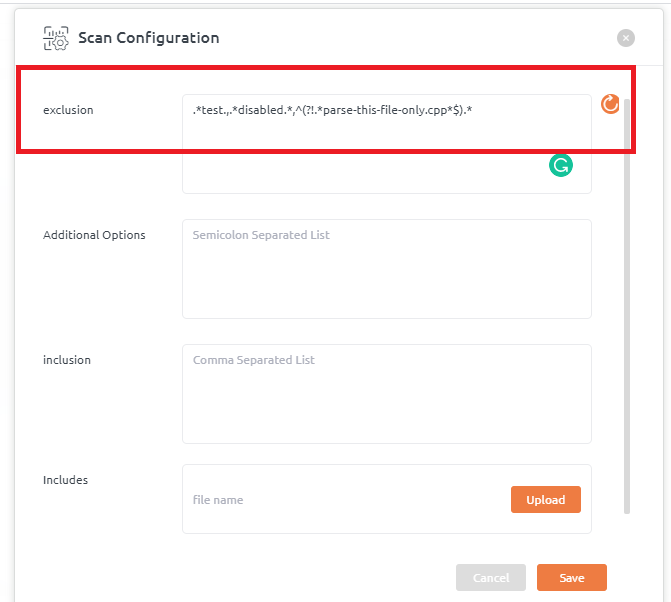
We can exclude particular source files by providing regular expressions. Regular Expression Format: JavaScript
Examples:
- To filter out files containing “test” keyword -> “.*test.*”
- To filter out everything but one file -> “^(?!.*parse-this-file-only.cpp*$).*”
- Use escape character to match special characters like +, . -> “.*test.c++*”
Additional Options:
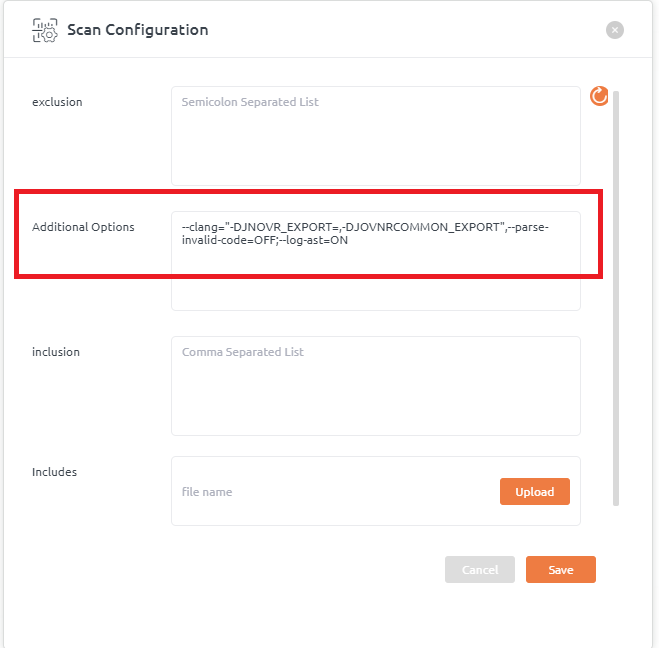
- Parsing invalid code:
By default, invalid code parsing is enabled but, it can be disabled using the following option.–parse-invalid-code=OFF
There is limited support for invalid code parsing, and it is prone to parser crash (very rare), so if for some codebase parser is crashing, please disable the invalid code parsing.
- Recursive include header search
By default, the parser searches for any header file recursively in all the sub-directories of the source folder. This can lead to incorrect results if there are multiple header files with the same name but in different folders.
To disable searching in all sub-directories use the following option
—include-all=OFF
- Define macros
Macros can be defined with GCC like option format.
Example: To define macro MY_MACRO -> –clang=”-DMY_MACRO=”
Any option to compiler can be given with –clang=””
Inclusion
- A comma-separated list of regular expressions should be added in Scan Configuration pop-up window >> inclusion
Includes
- Look for Includes label and upload zip of include files.
- Click Save.
Integration with CI/CD tools
Embold is integrated into the Software Development Life Cycle (SDLC), enabling the early detection of code issues, anti-patterns, etc. Embold scan can be automatically triggered after the source is built. Integration of Embold with CI/CD tools requires sign-in with the Embold Server deployed within the organization.
GitLab Integration
After integrating Embold with GitLab, users can scan their code after every GitLab build pass. Users can also configure Embold modules (tools) using gamma_scansettings.json at the GitLab level.
CI Integration pipeline
In this mode, Embold integrates with the CI system (Gitlab in this case) to run scans as part of the pipeline run. The following diagram shows the Embold setup with Gitlab:
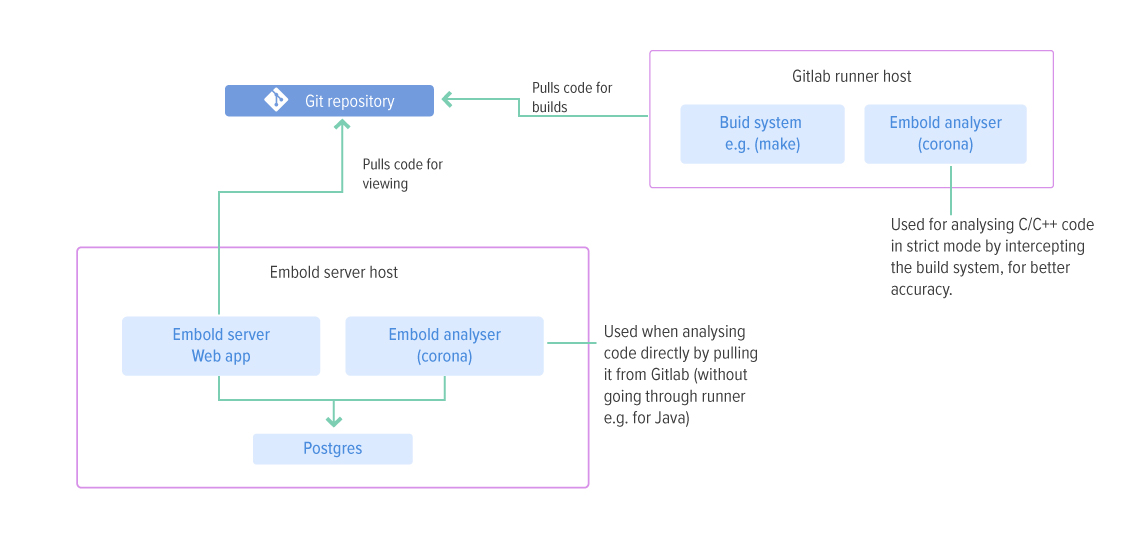
In this case, the “Corona” component of Embold is deployed additionally on the Gitlab Runner host. The Corona component analyses code which was pulled on the Gitlab Runner during pipeline runs. If running C/C++ pipelines, it is recommended to run Corona in “strict” mode. This involves intercepting the build process to extract compiler command invocations, generating a compilation database, and using that database for the analysis. This approach results in maximum accuracy for C/C++ systems.
Prerequisites
- Remote Analysis should work from GitLab machine (where GitLab runner is running) to Embold machine. (Refer Remote Scan for more info).
Installations Steps
- Install standalone Corona for Ubuntu, Windows or RedHat Enterprise Linux/CentOS at your desired location (e.g. /opt/gamma ). It will be your GAMMA_ROOT folder.
- Recursively change the owner of the GAMMA_ROOT folder (e.g. /opt/gamma folder) to GitLab user (e.g. sudo chown -R gitlab-runner /opt/gamma)
- PostgreSQL on your remote Embold instance should be configured.
- Recursively give read/write/execute permission to the GAMMA_ROOT folder for GitLab users. (e.g. sudo chmod -R 744 /opt/gamma)
- Download and update scan configuration json from gamma UI
- Update the .gitlab-ci.yml file the source code. Refer below table.
- In case of running gcov, Gcovr should be installed on the build machine.
With the above settings, when the runner is launched by Gitlab while executing the pipeline, it will now also include Embold code scans.
| Operating system | .gitlab-ci.yml changes |
|---|---|
| Windows | set GAMMA_ROOT= C:\workspace\gitlab\gitlab_corona ‘%GAMMA_ROOT%\corona\tools\bin\gitlab_wrapper.bat gammascan.json’ |
| Linux | export GAMMA_ROOT=/opt/gamma $GAMMA_ROOT/corona/tools/bin/gitlab_wrapper.sh gammascan.json |
GAMMA_ROOT is where the standalone corona is installed on the runner (GAMMA_ROOT should have a folder “corona” directly in it)
Jenkins Integration
Embold Jenkins Plugin allows users to scan code after Jenkins build is triggered. Users can configure Embold modules from this plugin. The plugin requires sign-in with the Embold Server deployed within the organization.
Prerequisites
- Jenkins version 2.289+.
- Remote Scan should work from Jenkins machine (where build is happening) to Embold machine.
- Download Embold scanner from your Embold Customer Portal > Releases tab > CLI. There will be one file with names similar to the following: ‘browserstack-codequality-scanner.tar.gz’.

- For running gcov, Gcovr should be installed on the build machine.
- JDK (Java Development Kit)
- JAVA_HOME environment variable need to set for build machine (master or slave) which should point to
/bin
Installation Steps
Embold integration in Jenkins can be done using 2 approaches:
- Using Embold plugin (Check limitations) or
- Using a pipeline script. click here
Jenkins Plugin
Limitation in Jenkins Embold plugin:
- It is not supported in pipeline jobs.
- Embold scanner packages will not update automatically, you need to replace the new Embold scanner folder for every new release.
Installation steps
- Untar embold-scanner-1.9.7-archive.tar.gz to some location on Jenkins master/slave.
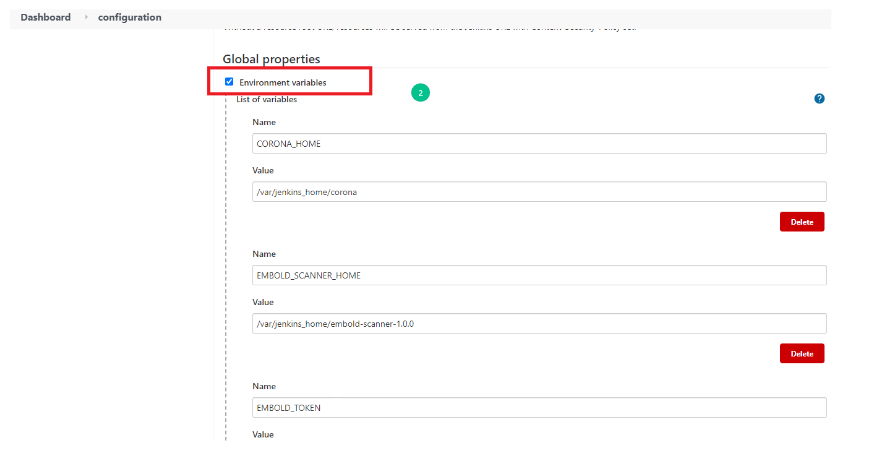
- Add the environment variables
CORONA_HOME,CORONA_LOG,EMBOLD_SCANNER_HOME.CORONA_HOME: Specify the location where Embold packages will be downloaded (e.g /opt/gamma/corona).CORONA_LOG: Specify the location where logs for Embold Analysis will be generated.
Note: The directory should have write permissions.
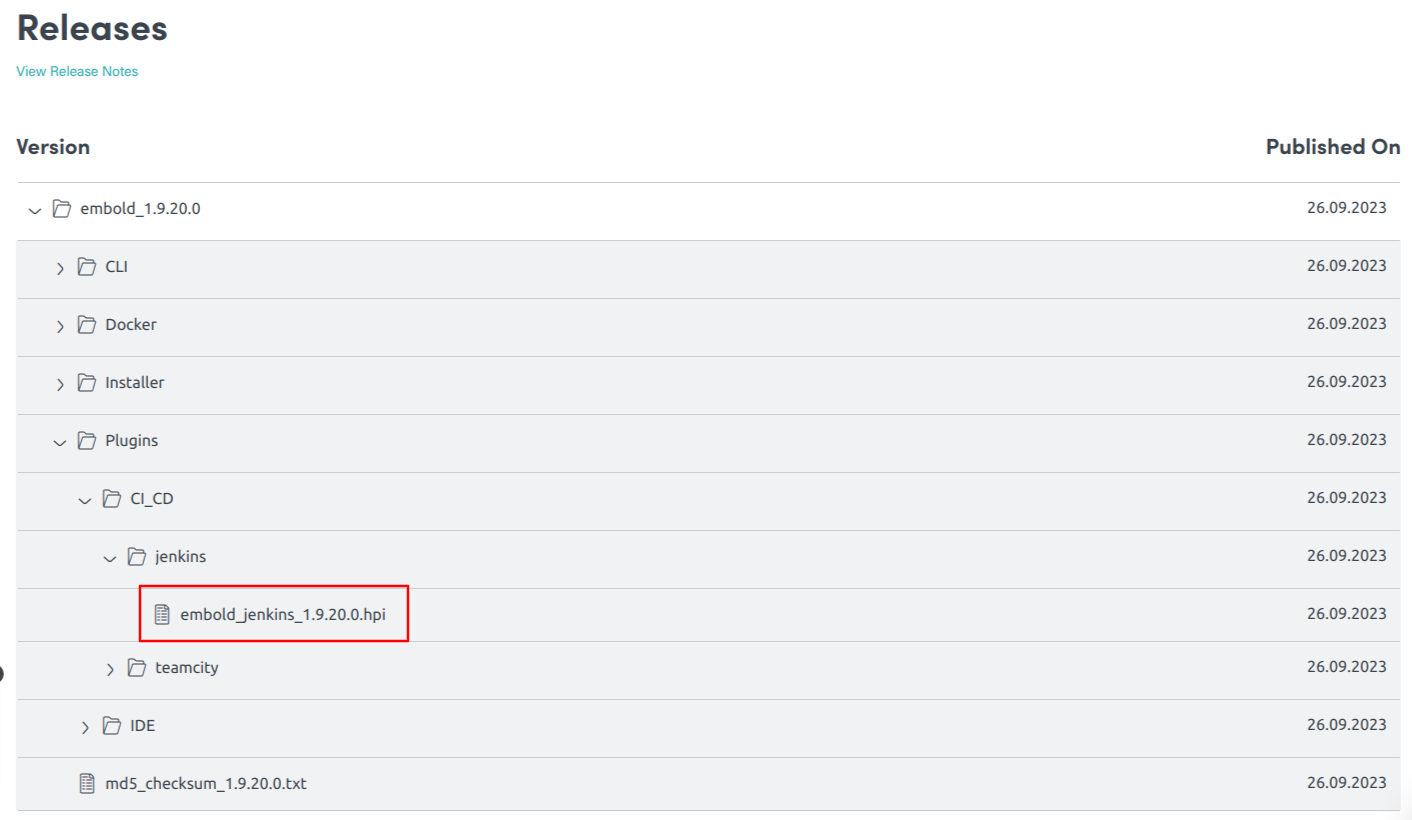
- Download Jenkins plugin from your Embold Account’s section > Releases tab > Plugins > CI_CD > jenkins. There will be file with a name similar to the following: Embold-Jenkins-Plugin-1.9.17.0.hpi.
- Click on “Manage Jenkins” on Jenkins’s home page.
- Jump to the Advanced tab.
- Go to the Upload Plugin section and upload “Embold-Jenkins-Plugin-1.9.17.0.hpi”.Click the “Upload” button.
- After Embold Jenkins Plugin is updated, Jenkins needs to be restarted.
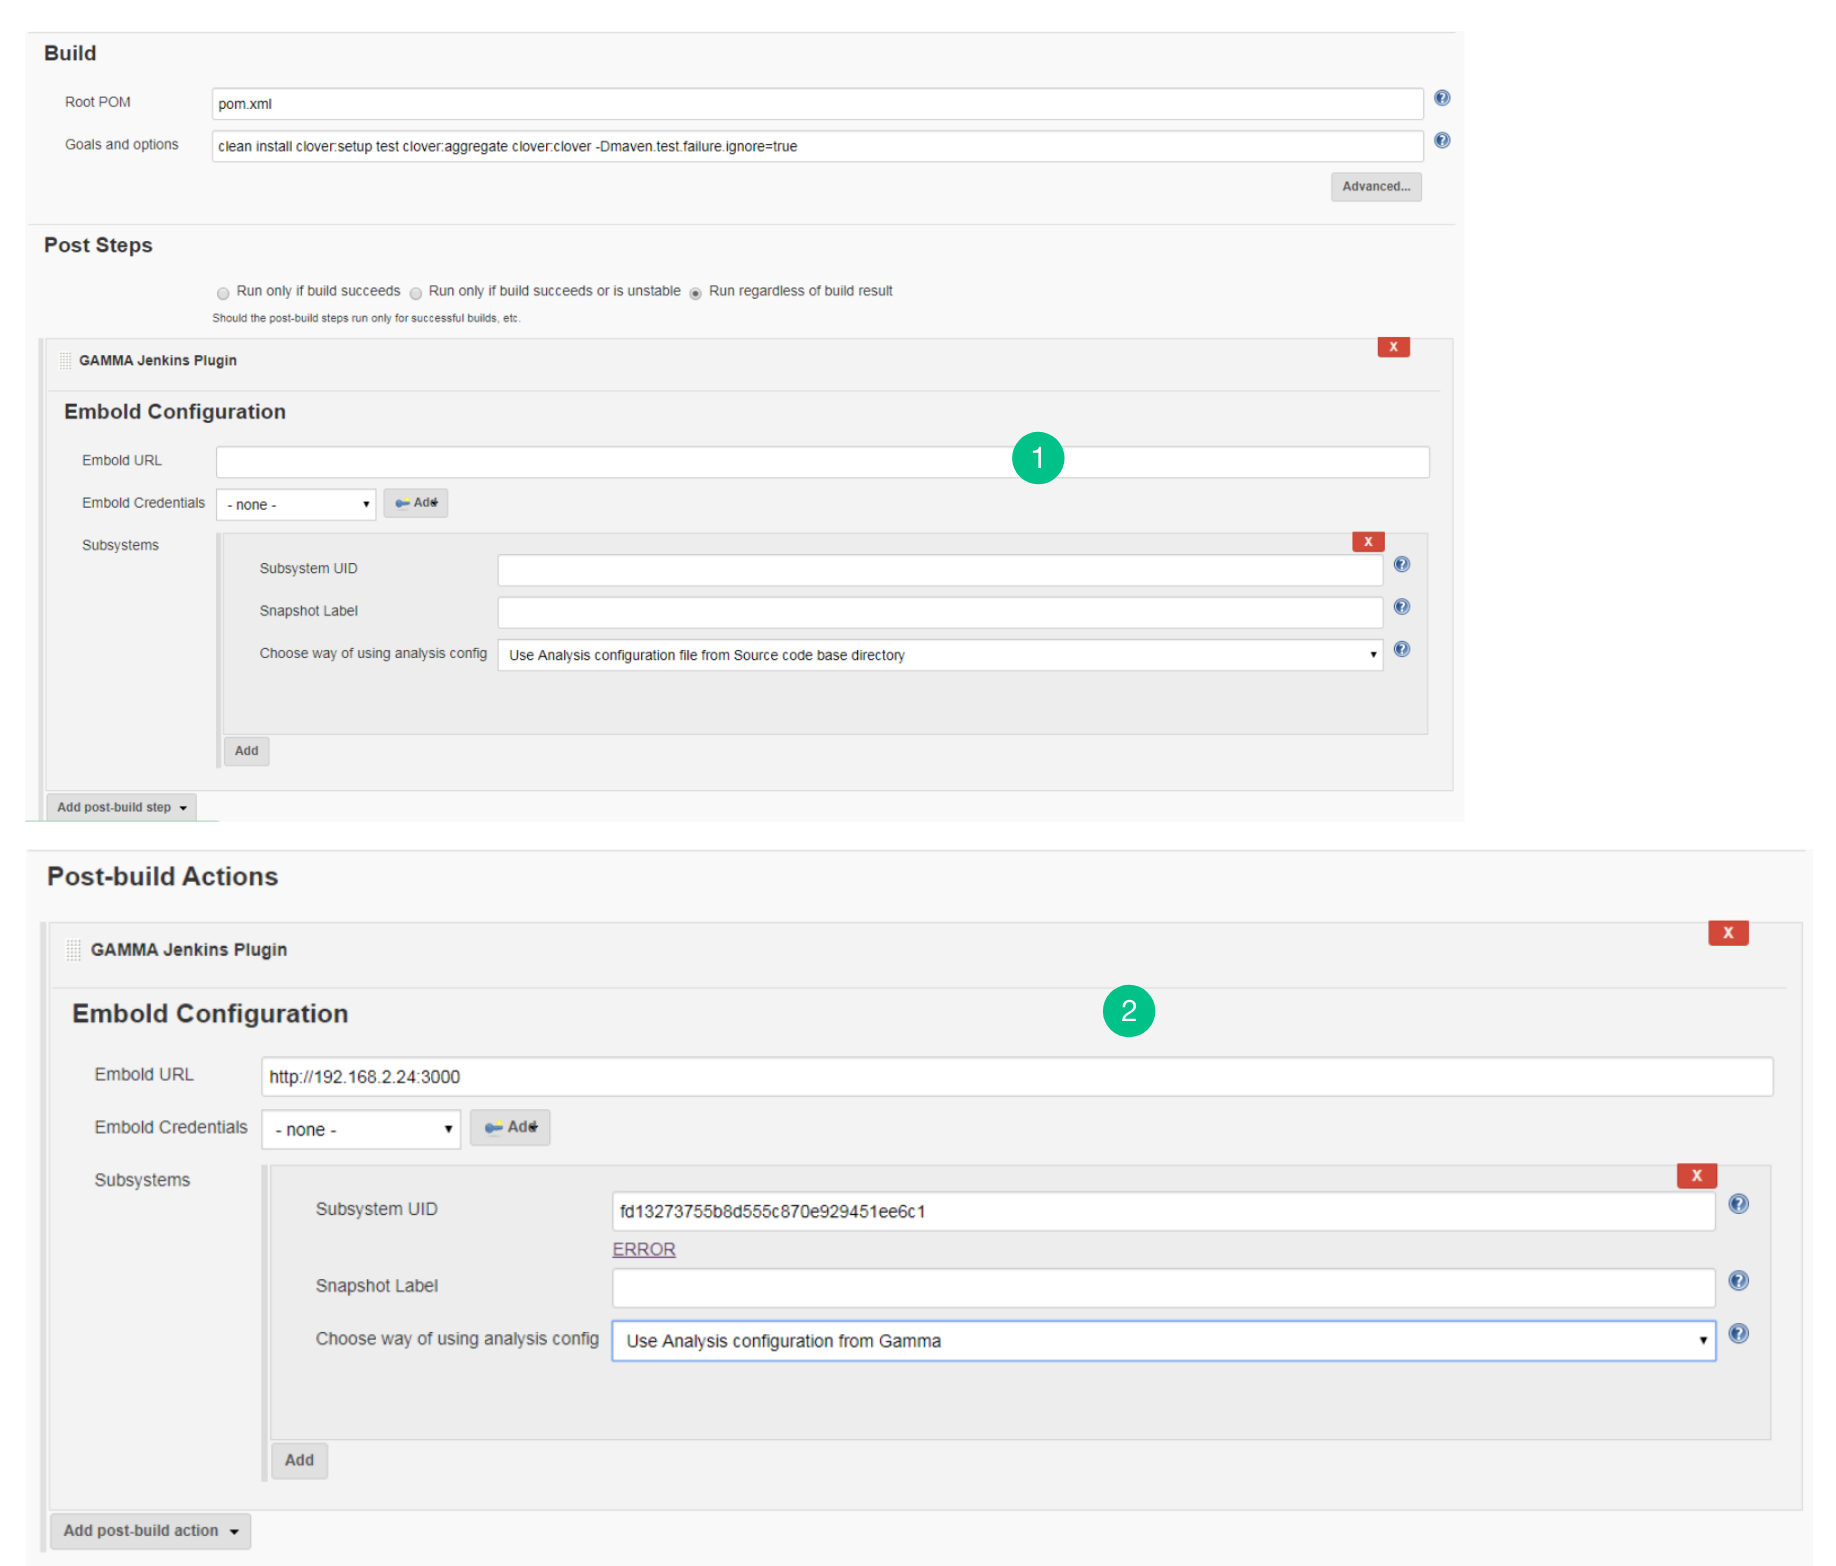
Integration Modes
- As Post Steps: Hooking into the build process so that Jenkins Job can be marked unstable if Embold’s quality gate check fails.
- As Post-build Actions:
- Hooking into Jenkins job workflow and gets triggered after the build is completed.
- In this mode, Embold Jenkins plugin will run irrespective, if the build has failed for any reason.
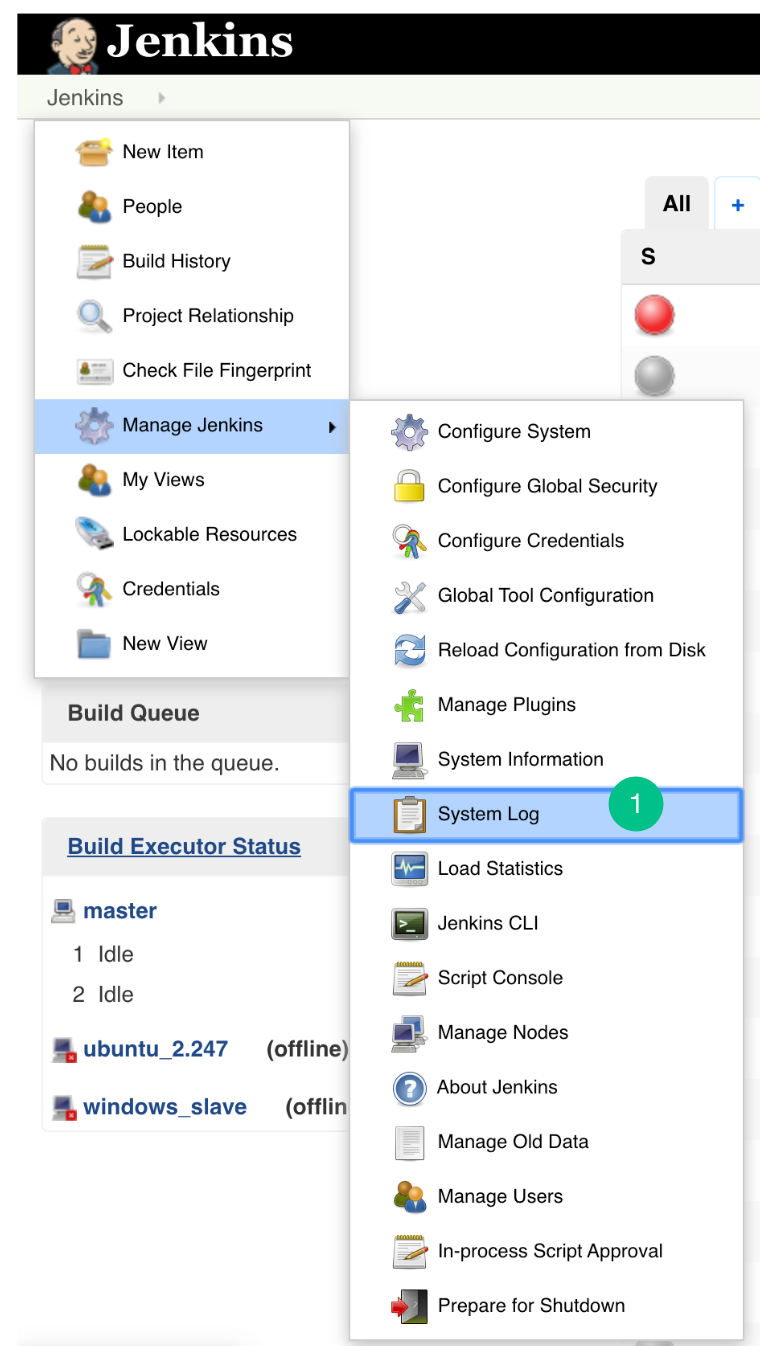
Configure Plugin Logs
- Go to the Jenkins> Manage Jenkins> System log. (Steps to add logging support)
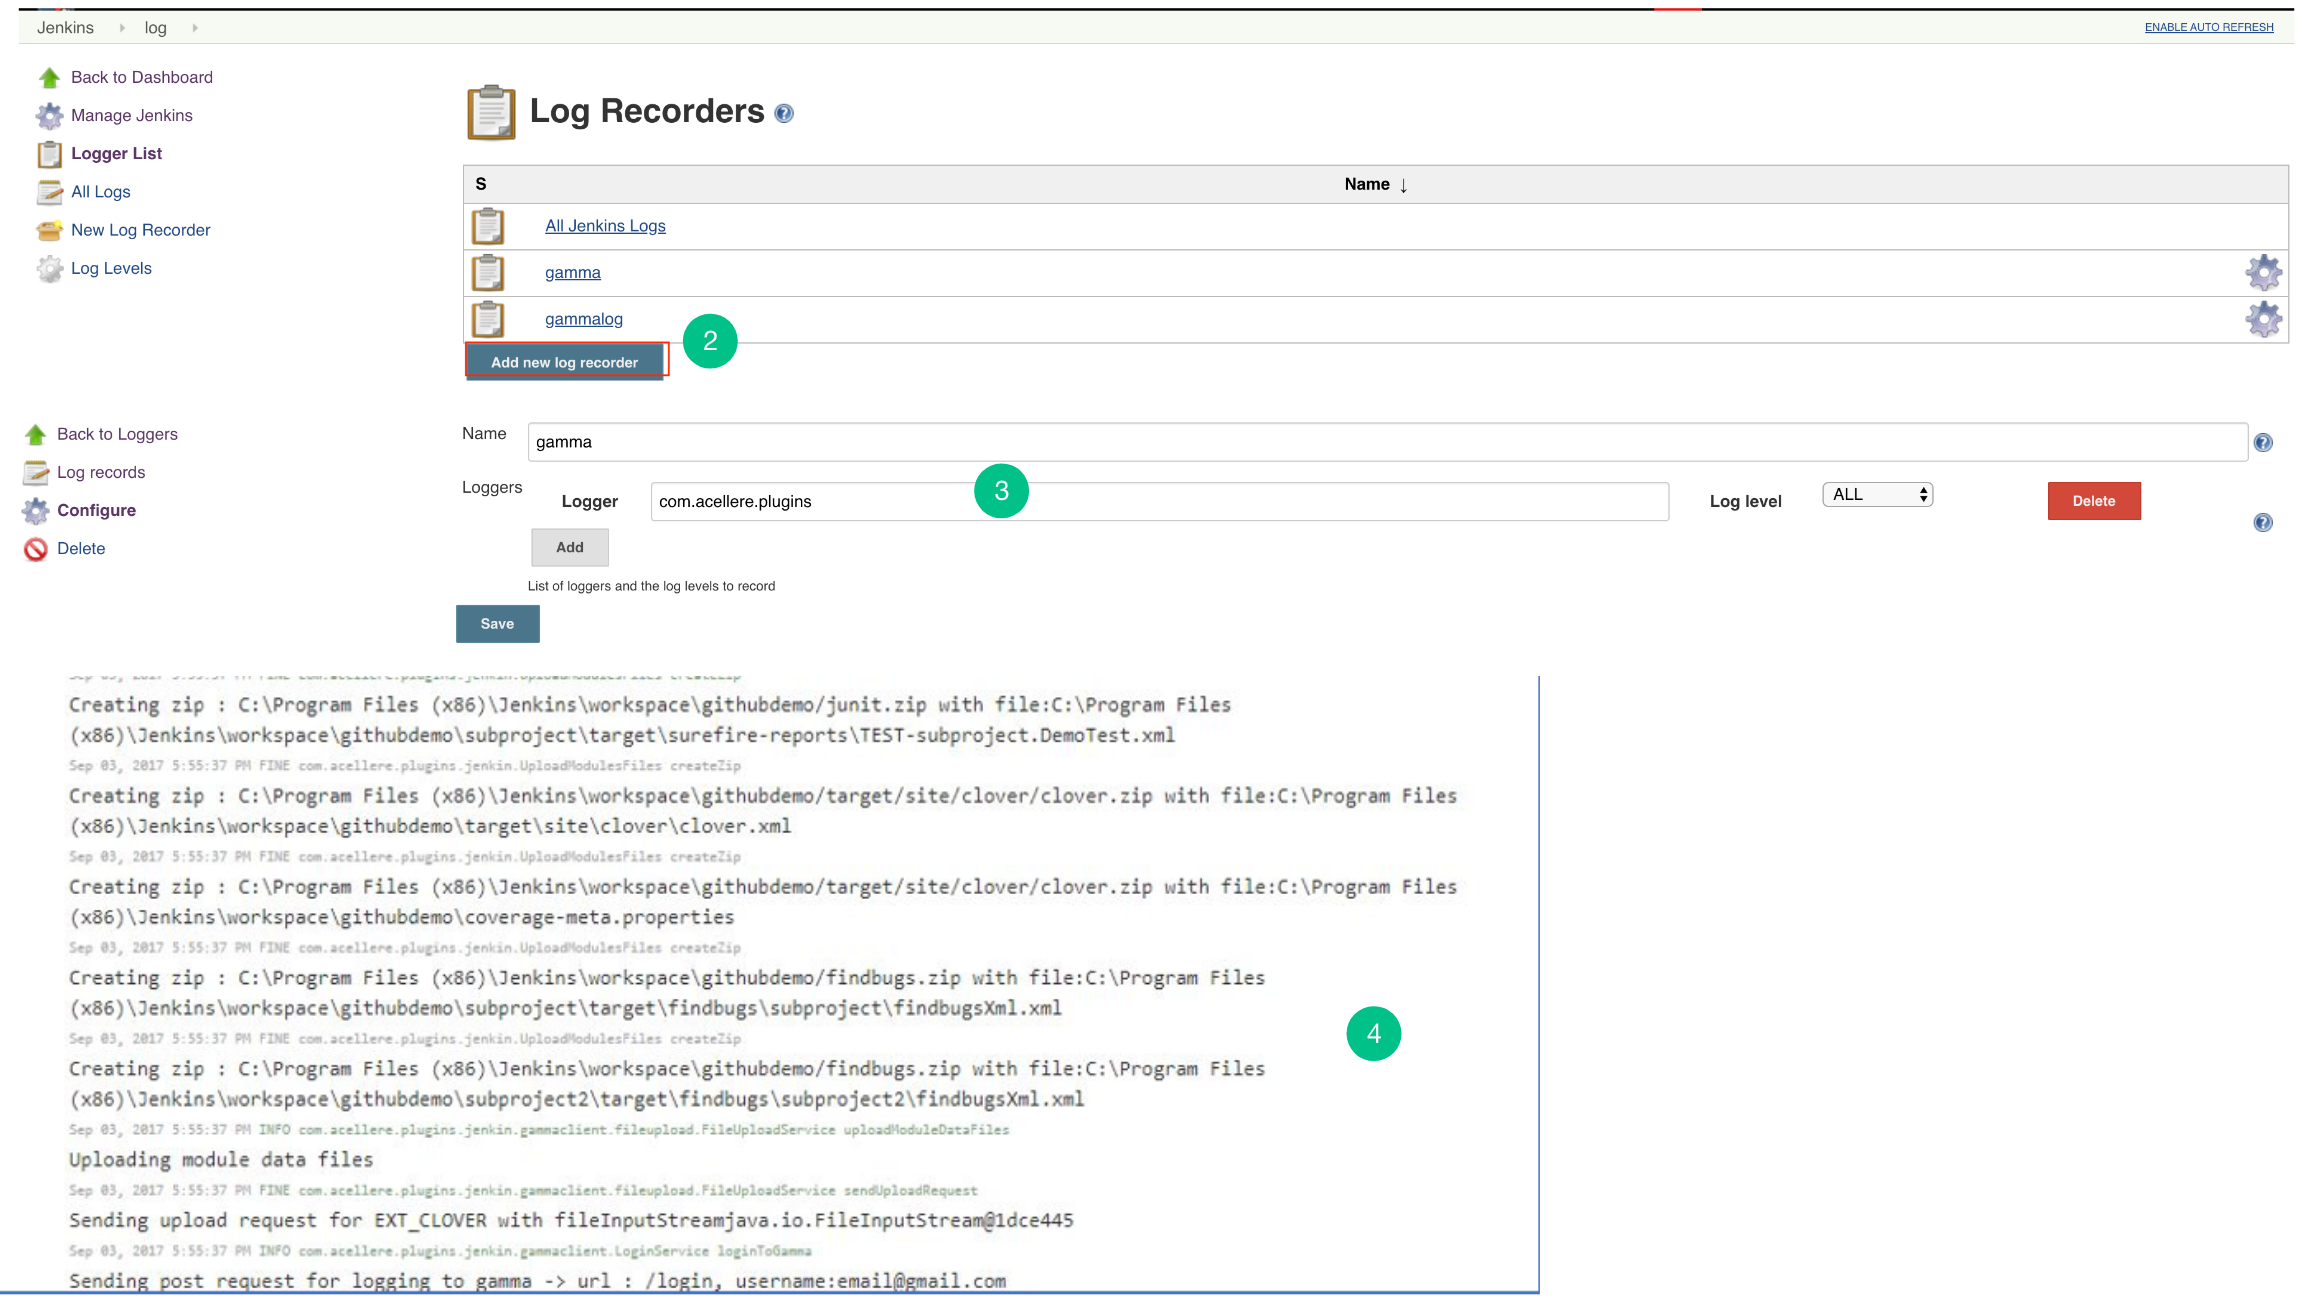
- “Add new log recorder” for Jenkins Plugin.
- The Logger should be com.acellere.plugins and the log level should be mentioned as “All”.
- You should only view Embold Jenkins Plugin related logs.
Post steps configuration of Jenkins Plugin
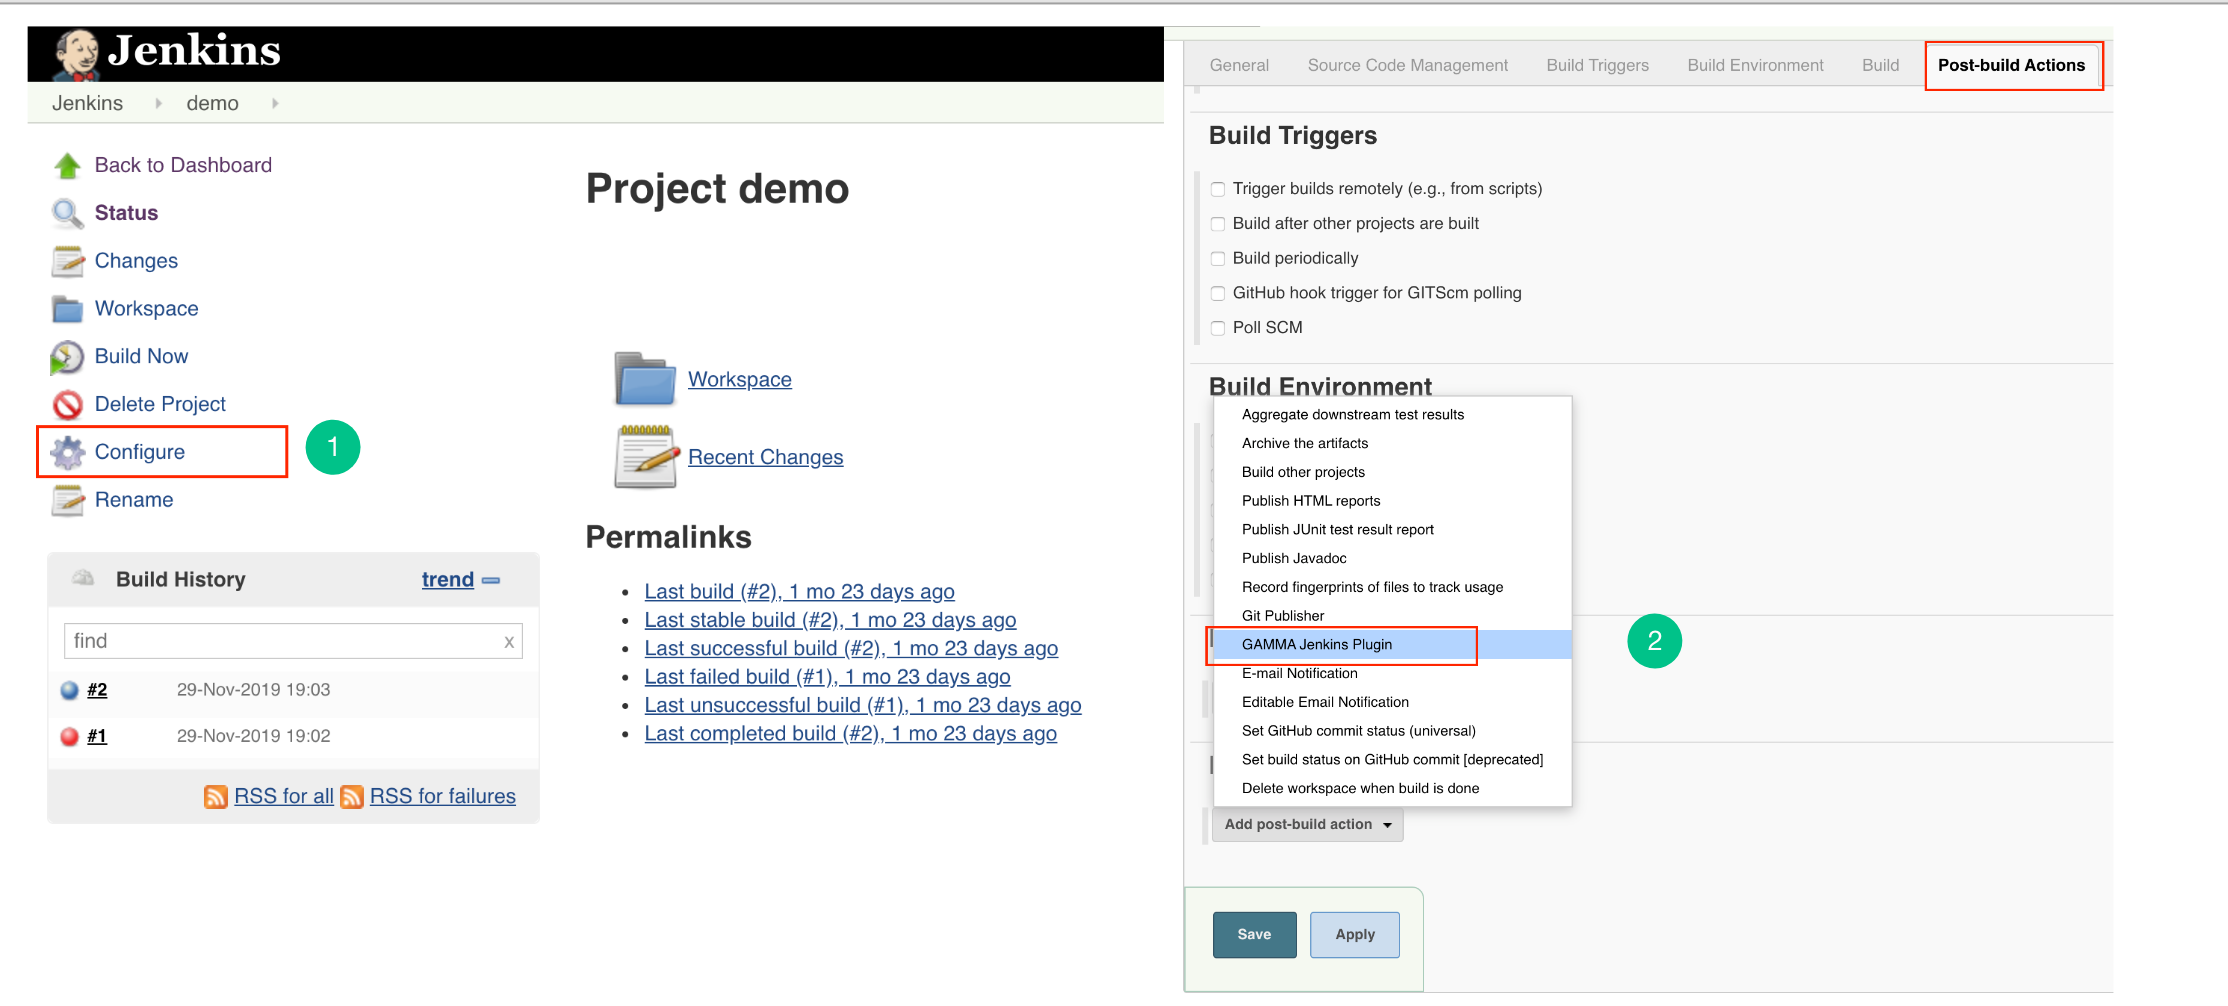
- Go to the “Configure” page.
- Go to Post Steps and from Add post-build step dropdown list, select “
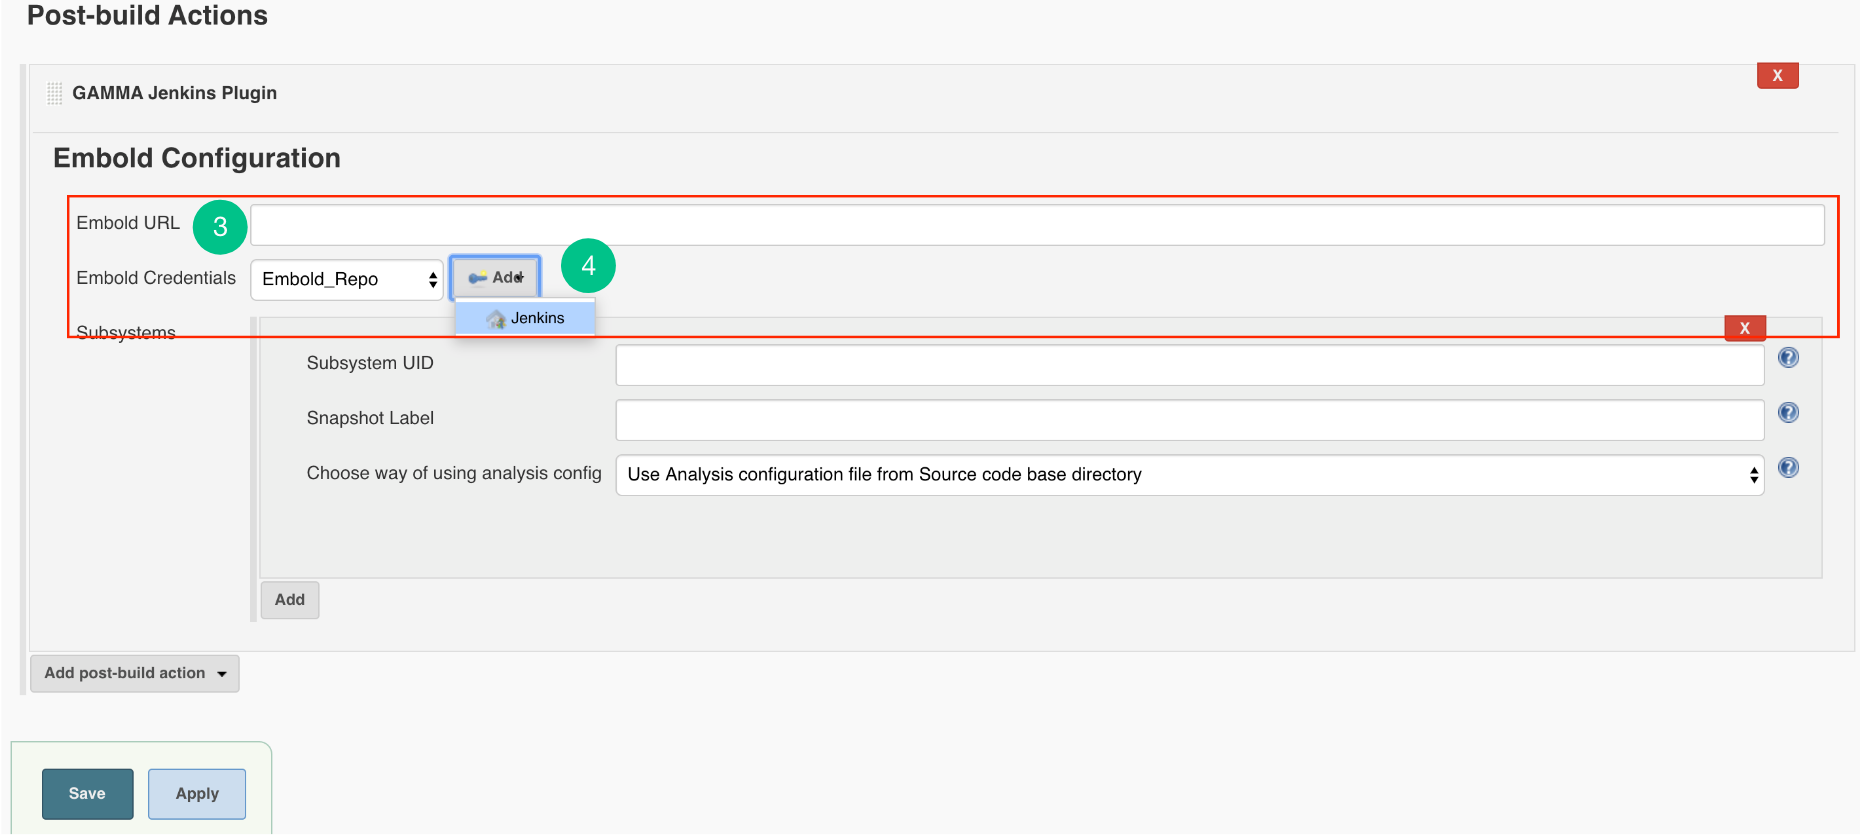
Embold Jenkins Plugin” option. - Embold Configuration Page is displayed to the user. Specify valid Embold URL (http://IP address of Embold Server:3000).
- Click on the Add button for adding Embold Credentials.
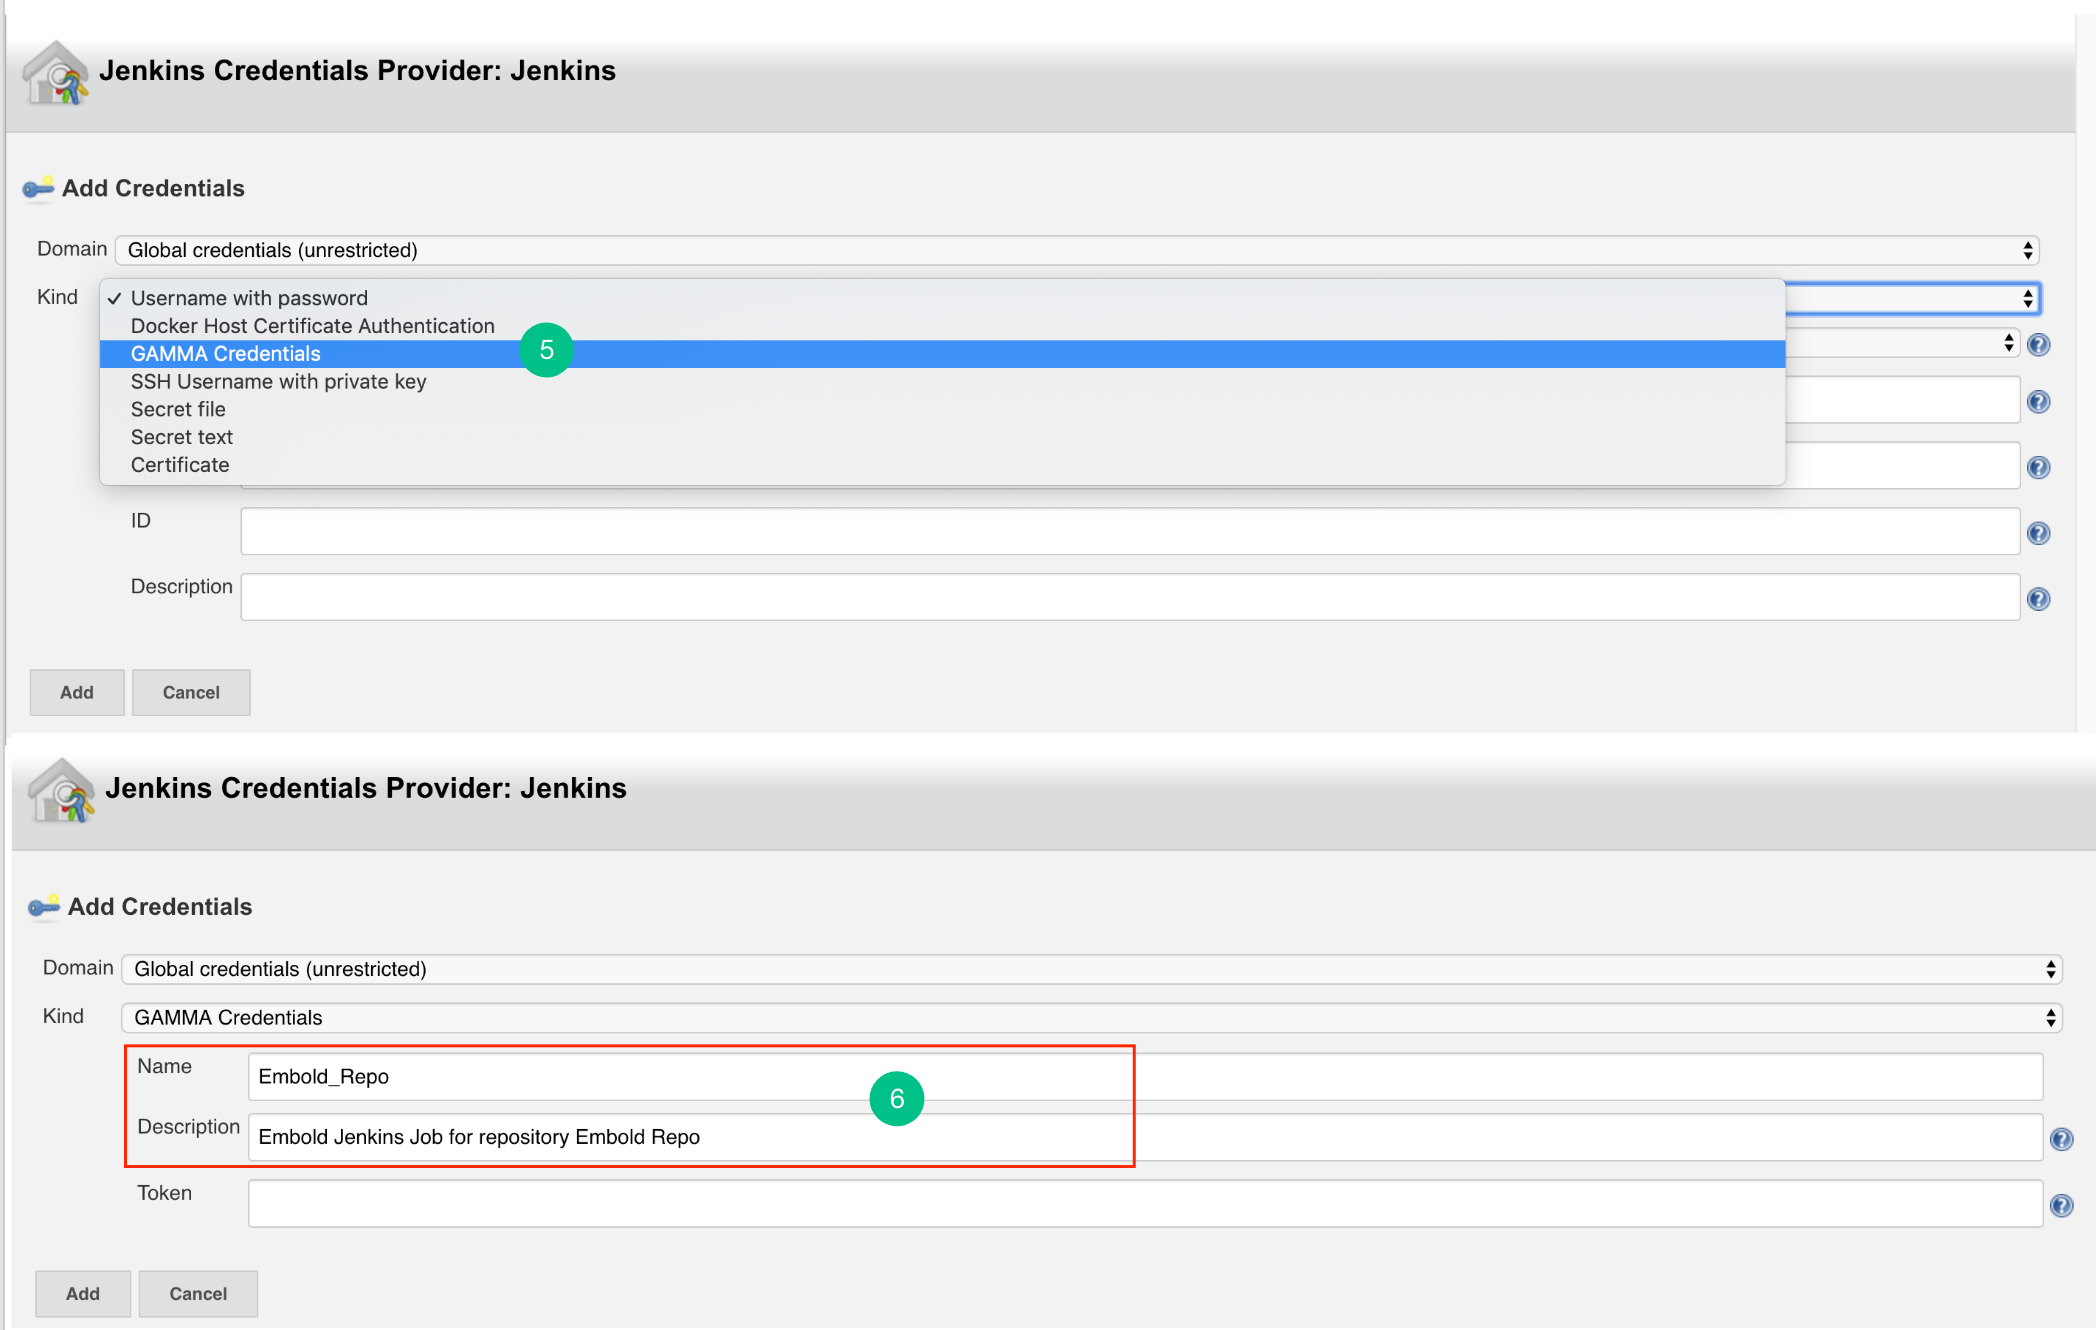
- In the Jenkins Credentials Provider pop-up, from Kind dropdown, choose “GAMMA Credentials”.
- Specify Name and Description which could be any value (it can be your Repo name or job name).
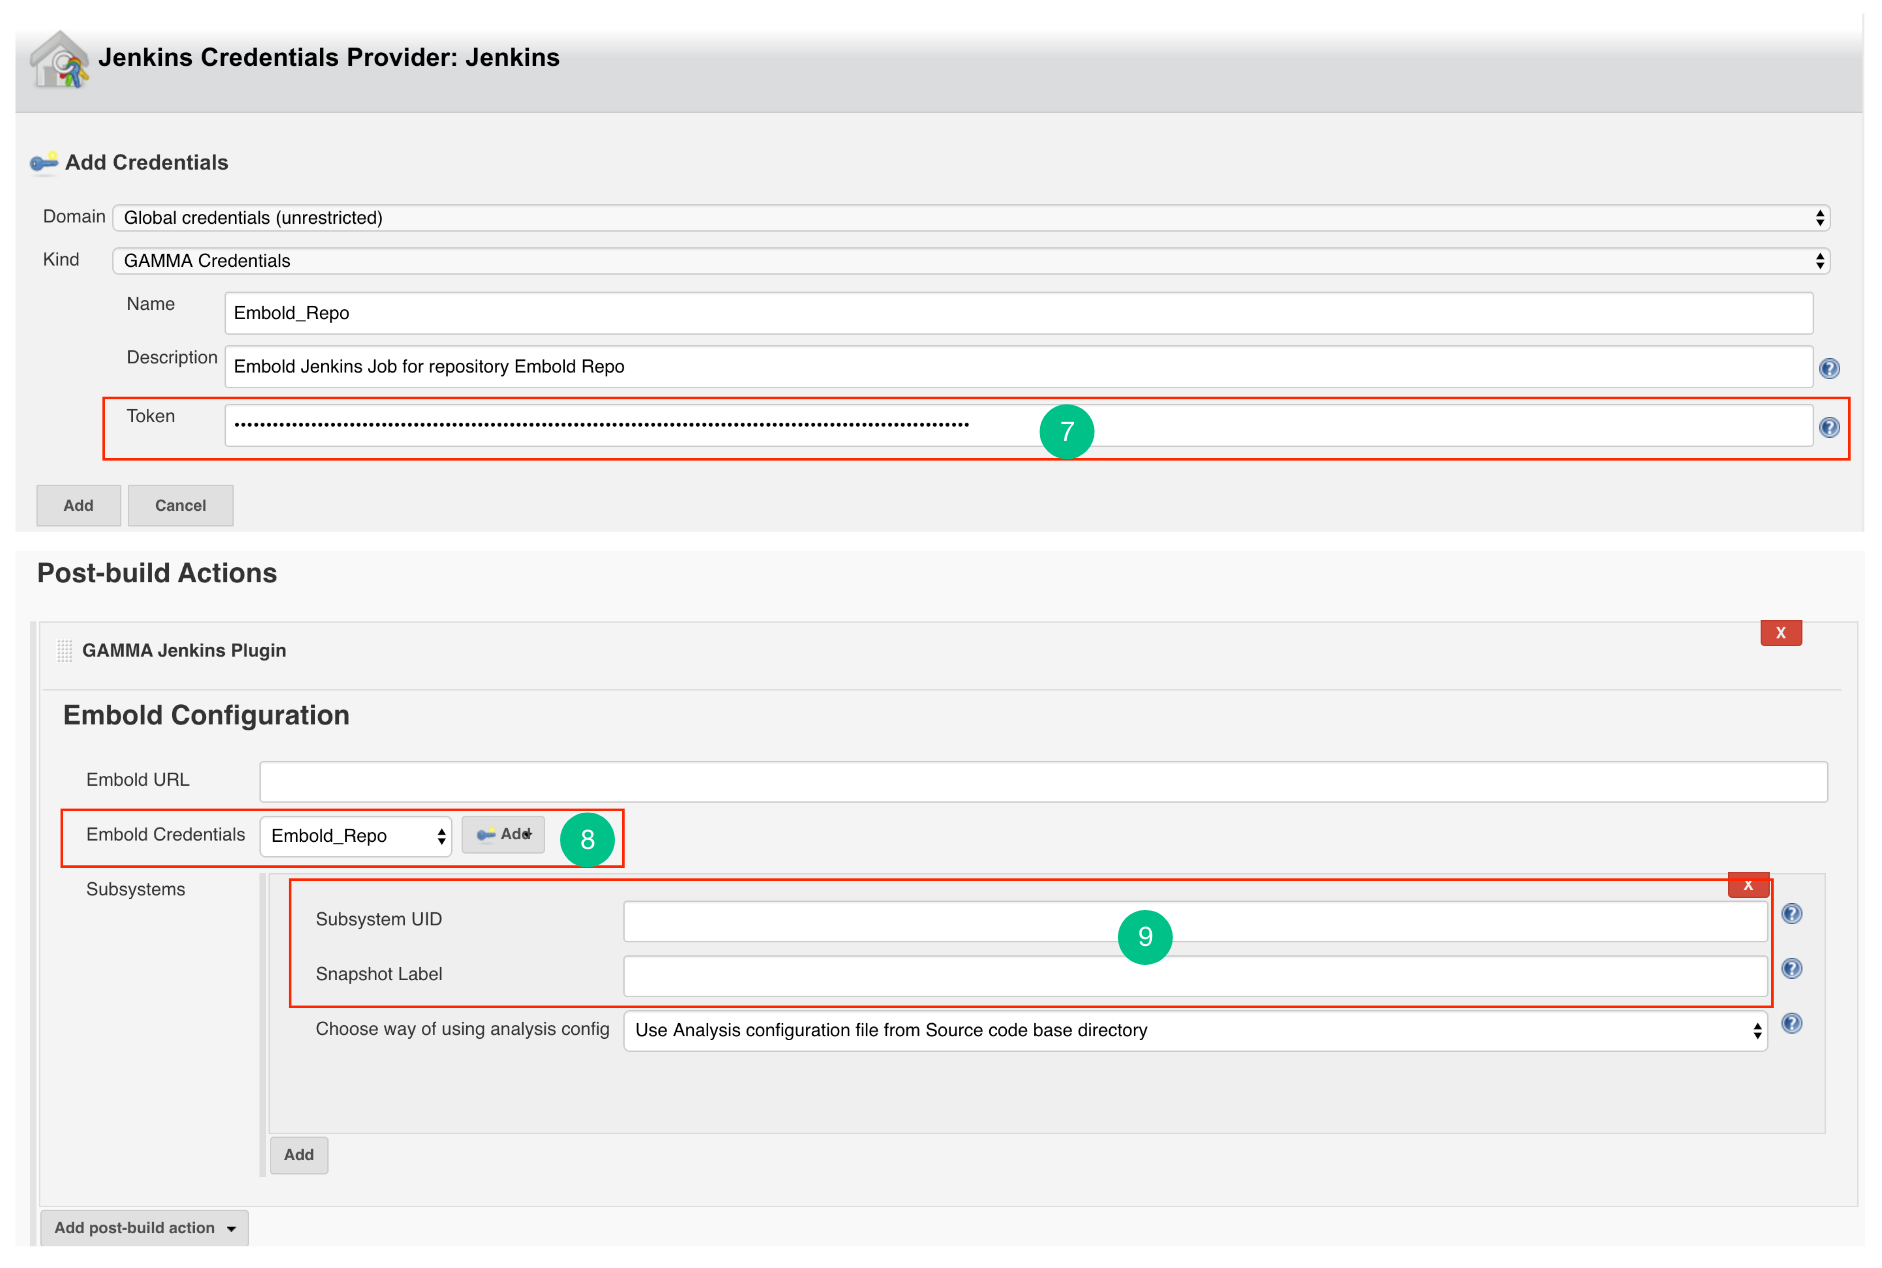
- Generate an Embold Access Token from the deployed Embold application website and add the Access Token under the Token section. Refer this article for generating Embold Access Token.
- After adding the Jenkins Credentials, select the added credential from the dropdown of Embold Credentials.
- Fill up the details in Subsystems section:
- Subsystem UID: Repository UID. Can be obtained from Repository information in corresponding project on Embold. Incorrect UID will throw an error.
- Snapshot Label (Optional): Provide the snapshot level value for Embold analysis. You can also provide environment variable. For example: BUILD_NUMBER
Configure Jenkins Plugin as Post-build Action
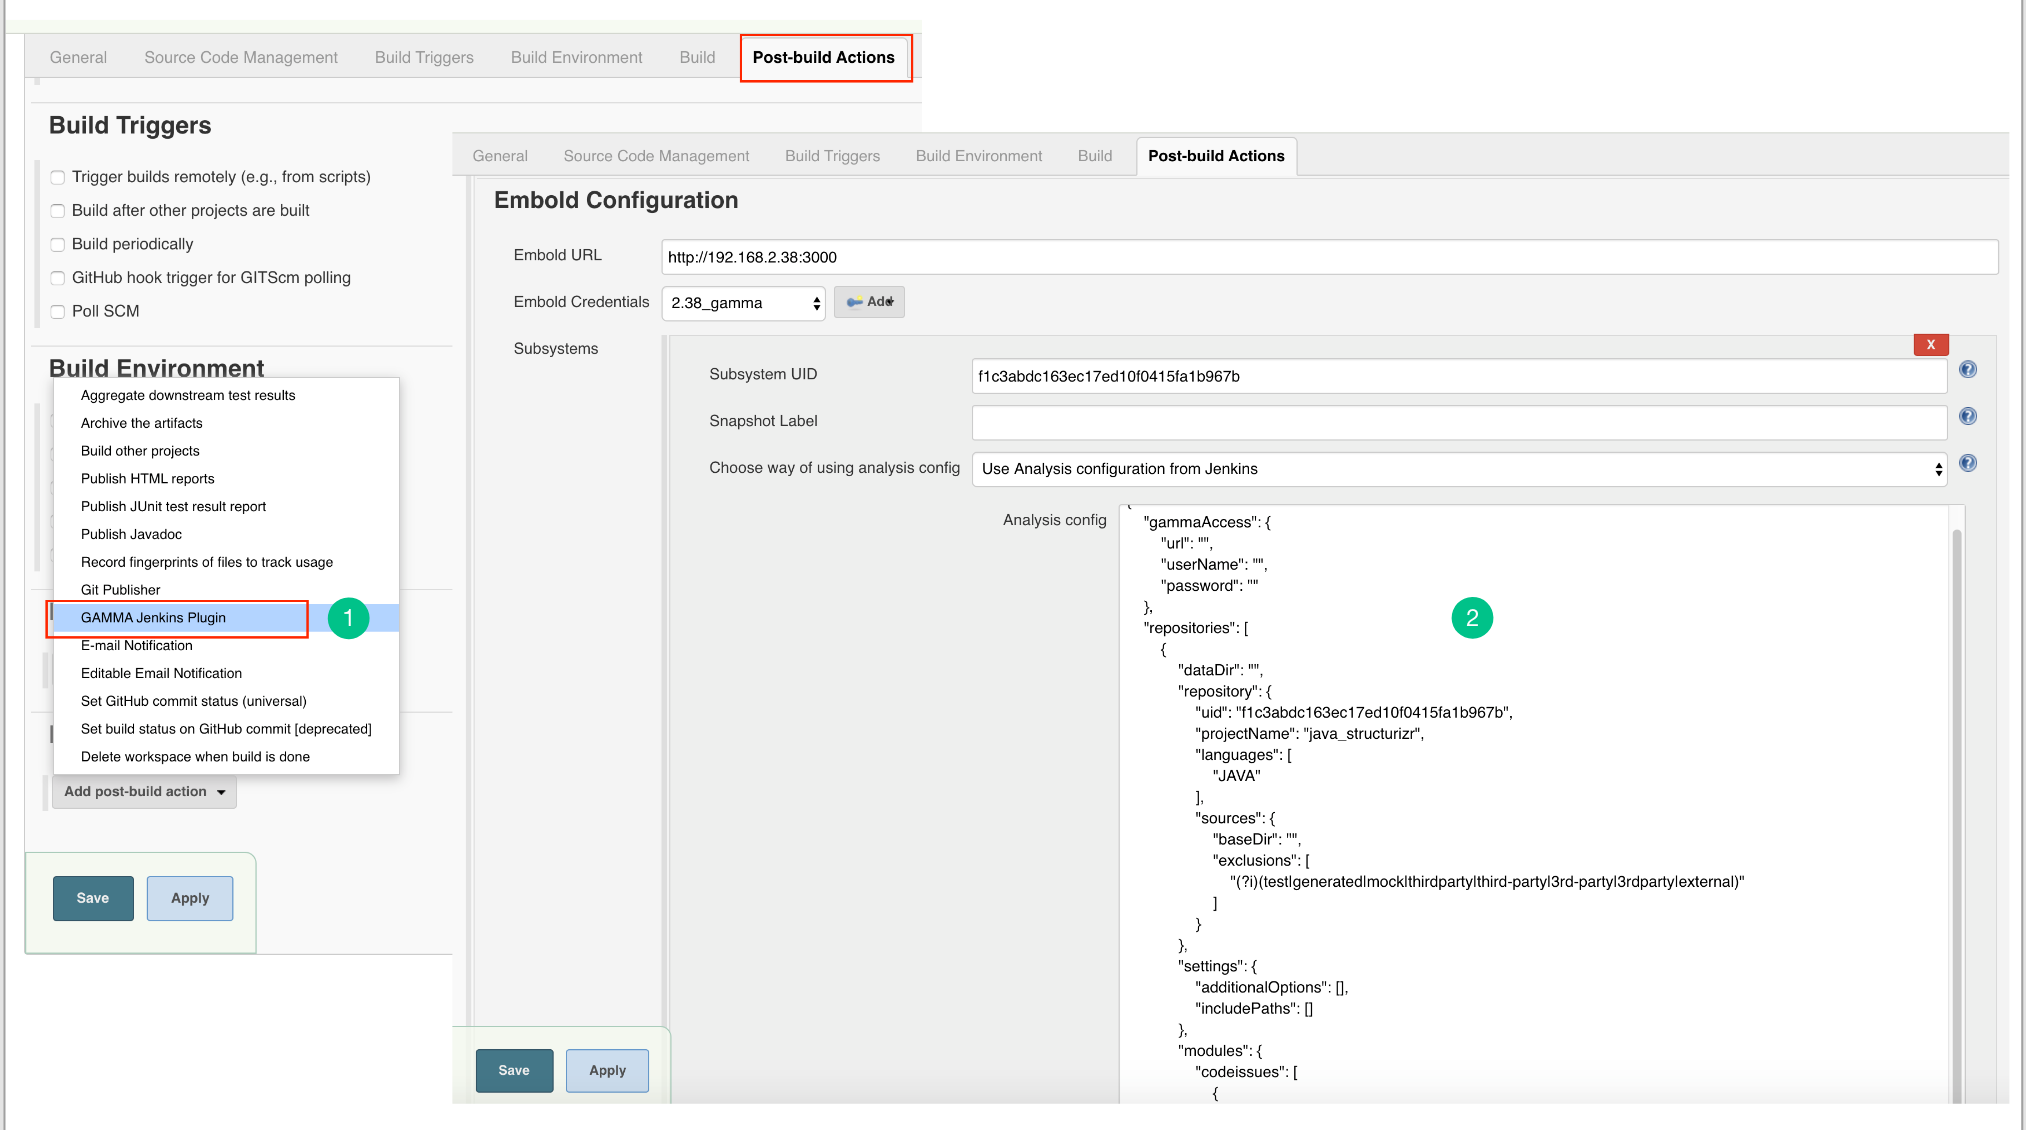
- Go to Post build Actions tab and add Embold Jenkins Plugin.
- You should see the Embold Jenkins configuration page.
- Embold Configuration Page is displayed to the user. Specify valid Embold URL (http://IP address of Embold Server:3000).
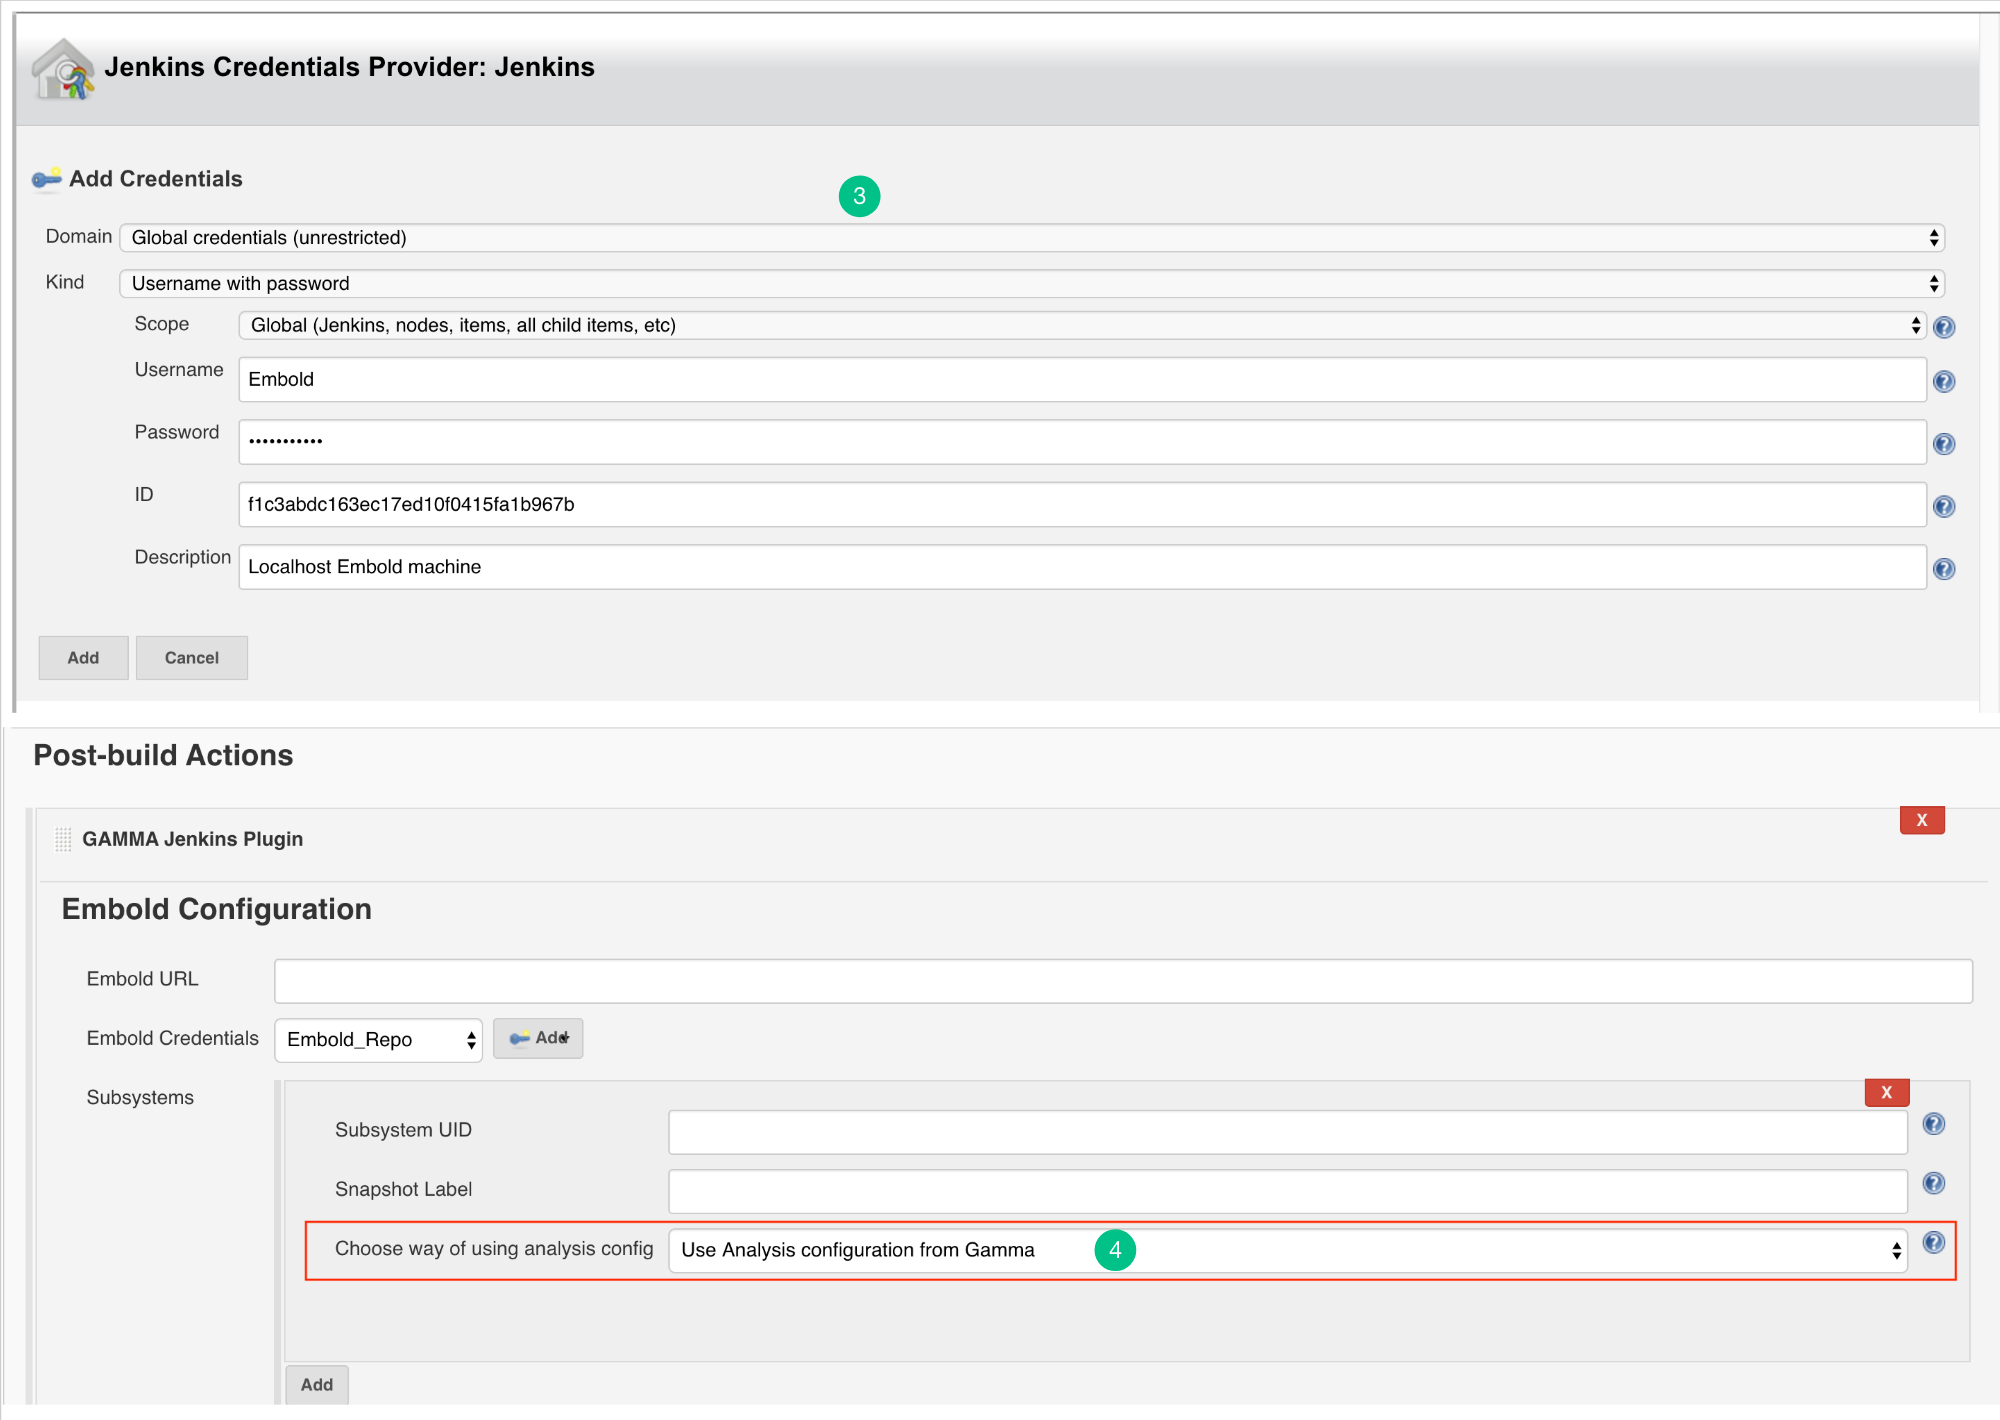
- Click on the Add button for adding Embold Credentials.
- In the Jenkins Credentials Provider pop-up, from Kind dropdown, choose “GAMMA Credentials”.
- Specify Name and Description which could be any value (it can be your Repo name or job name).
- Generate an Embold Access Token from the deployed Embold application website and add the Access Token under the Token section. Refer this article for generating Embold Access Token.
- After adding the Jenkins Credentials, select the added credential from the dropdown of Embold Credentials.
- Fill up the details in Subsystems section:
- Subsystem UID: Repository UID. Can be obtained from Repository information in corresponding project on Embold. Incorrect UID will throw an error.
- Snapshot Label (Optional): Provide the snapshot level value for Embold analysis. You can also provide environment variable. For example: BUILD_NUMBER
Configure Analysis Configuration file for Embold Jenkins Pugin for both modes
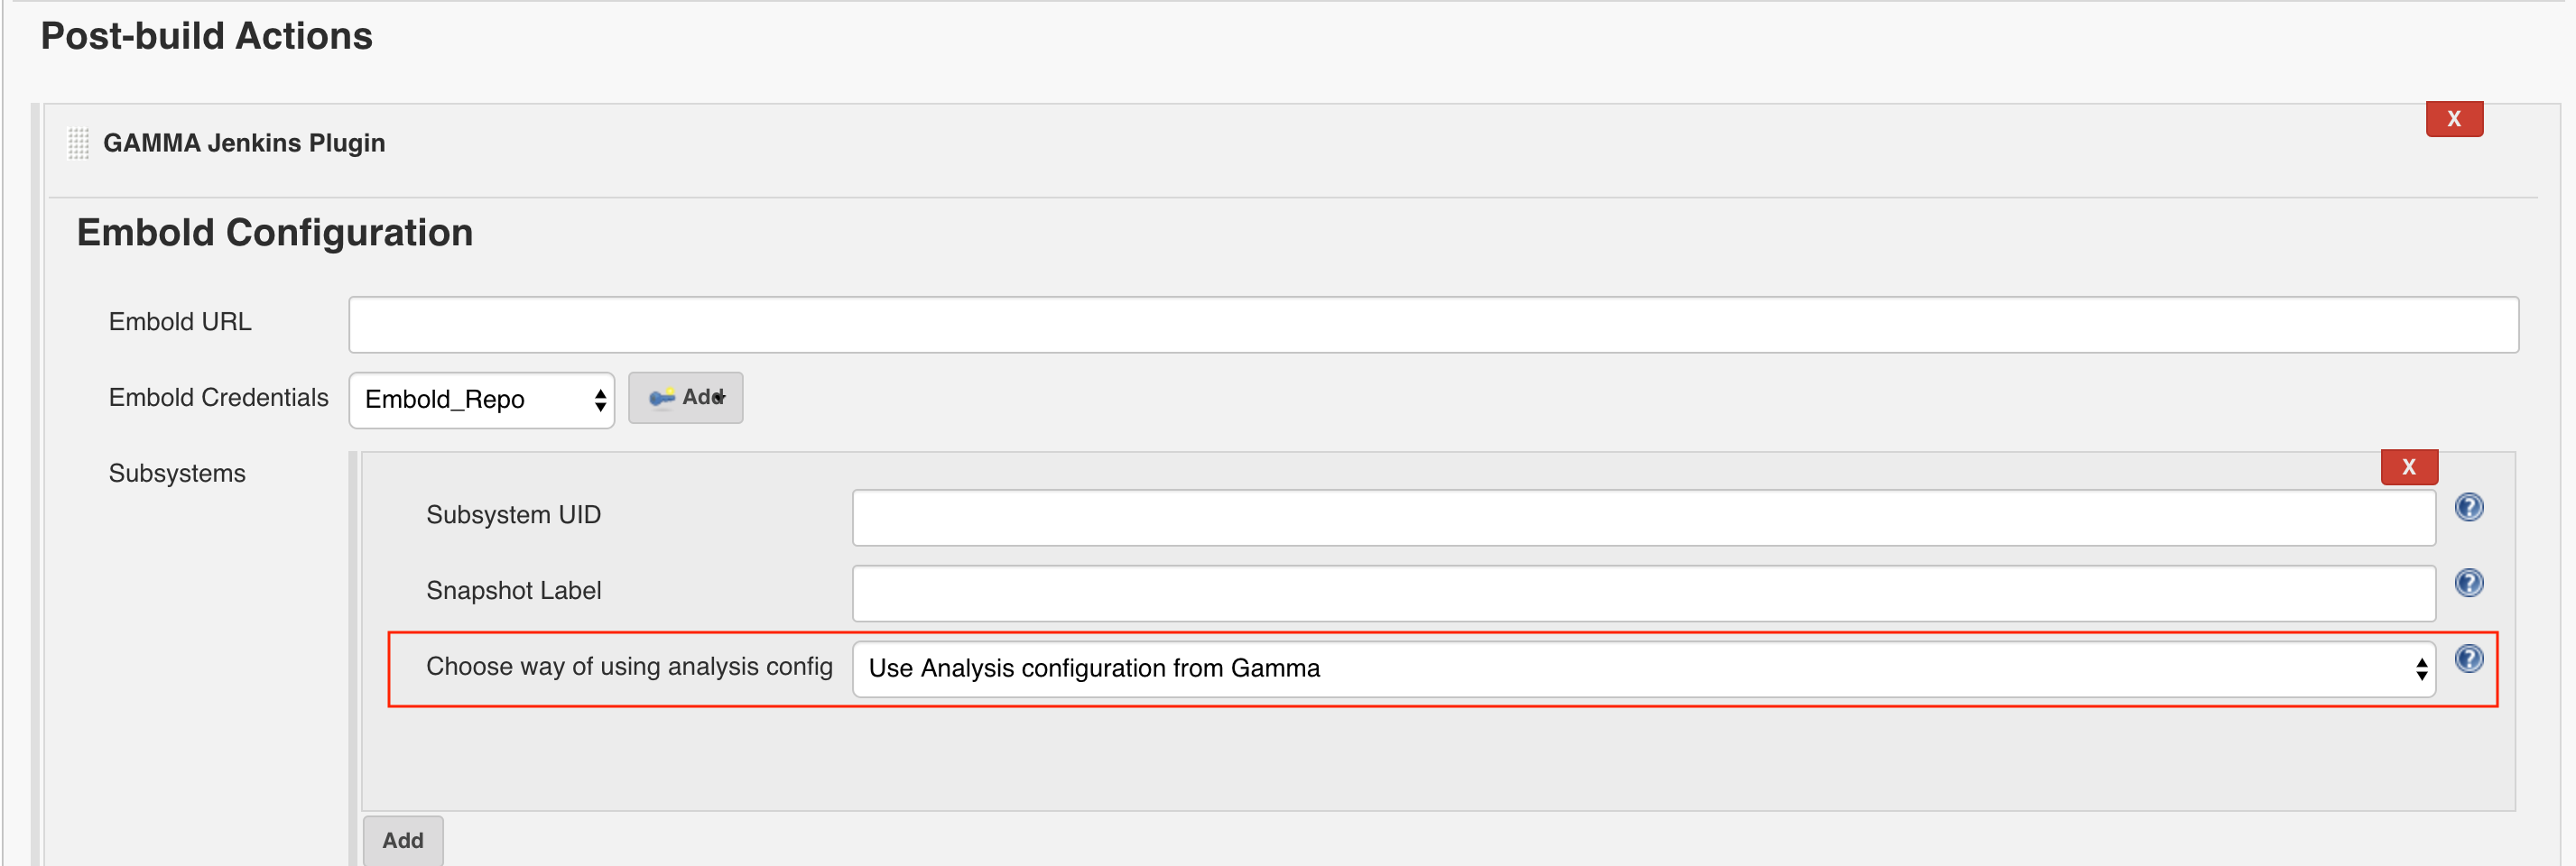
- Use Analysis configuration from Embold:
- Embold analysis configuration file with name ‘.gammascan.json’ containing subsystem configuration will be picked at runtime from. Embold server associated with the Subsystem ID specified.
- With this option, the configuration file will take the default path for Junit and Clover.
- Use Analysis configuration file from Source code base directory:
- Embold configuration file with name ‘.gammascan.json’ containing subsystem configuration should be present in the base(root) directory.
- Windows: C:/Program Files (x86)/Jenkins/workspace/{Project_Name}
/.gammascan.json - Linux: /var/lib/Jenkins/workspaces/{Project_Name}
/.gammascan.json
- Windows: C:/Program Files (x86)/Jenkins/workspace/{Project_Name}
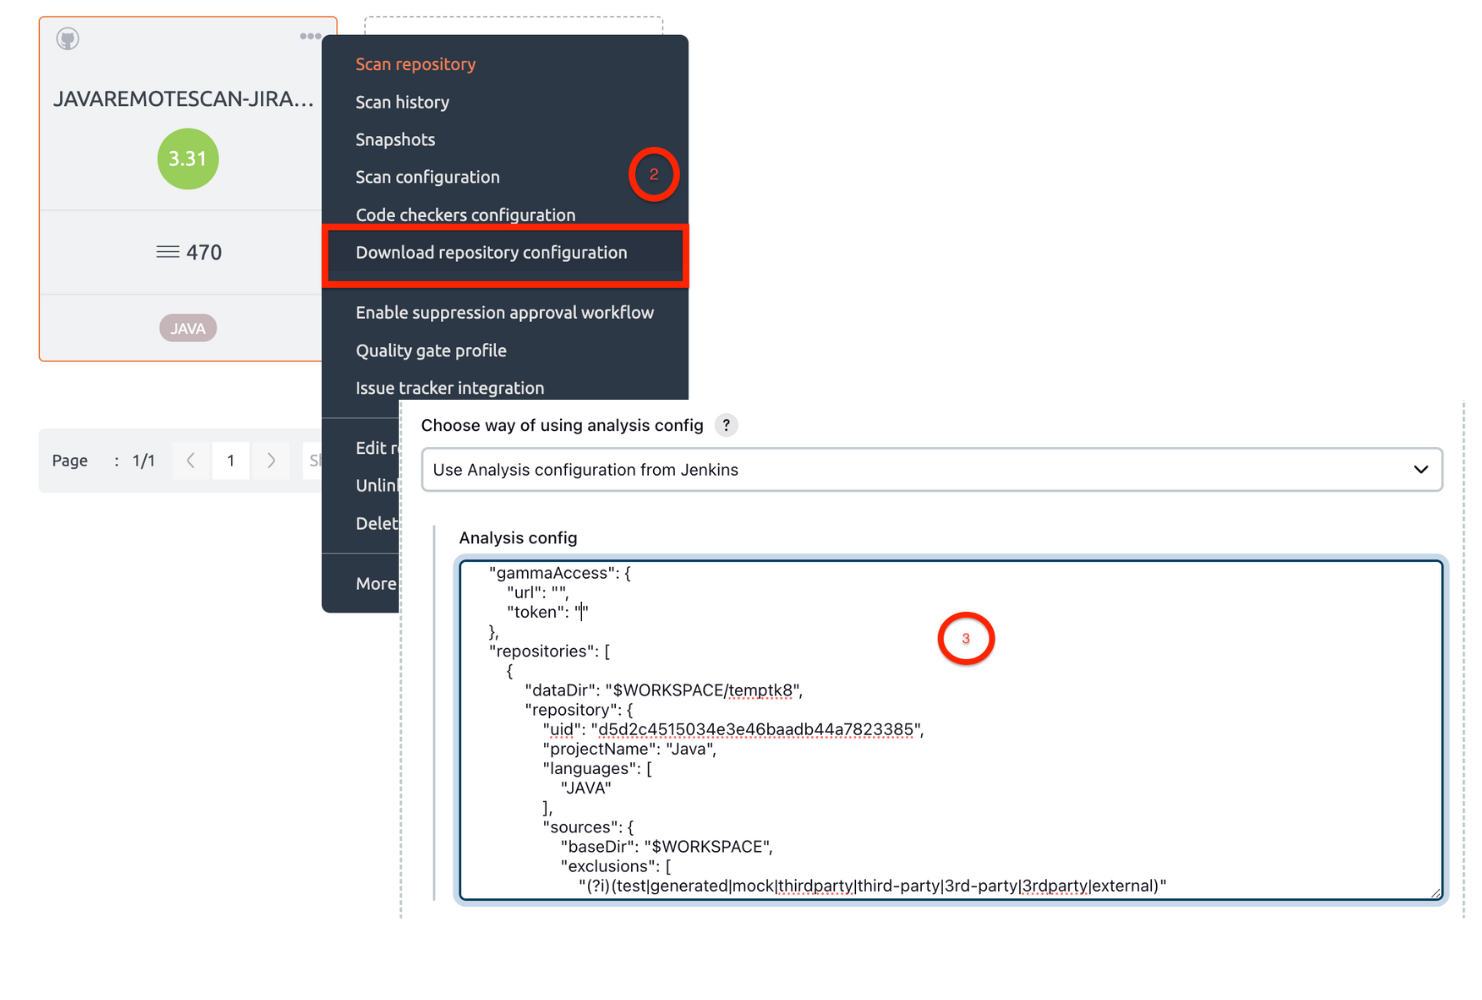
- Use Analysis configuration from Jenkins:
- Login to Embold. Create a project. Link the repository you want to scan.
- On your remote Embold instance, navigate to the repository you want to scan. Click on “…”. Download configuration json from Embold UI.
- Update the following fields in json.
- Replace baseDir value with $WORKSPACE OR %WORKSPACE%
Note: WORKSPACE = Jenkins workspace - Give custom directory path for Data directory
Note: Make sure Jenkins user has Write permission for dataDir.
- Replace baseDir value with $WORKSPACE OR %WORKSPACE%
- Give the analysis configuration JSON in Jenkins UI. Click on the “Apply” button. Check if any errors are displayed in any configuration field. Click on the “Save” button.
For more information to understand repository-configuration.json, refer to this article.
Steps for Master Slave:
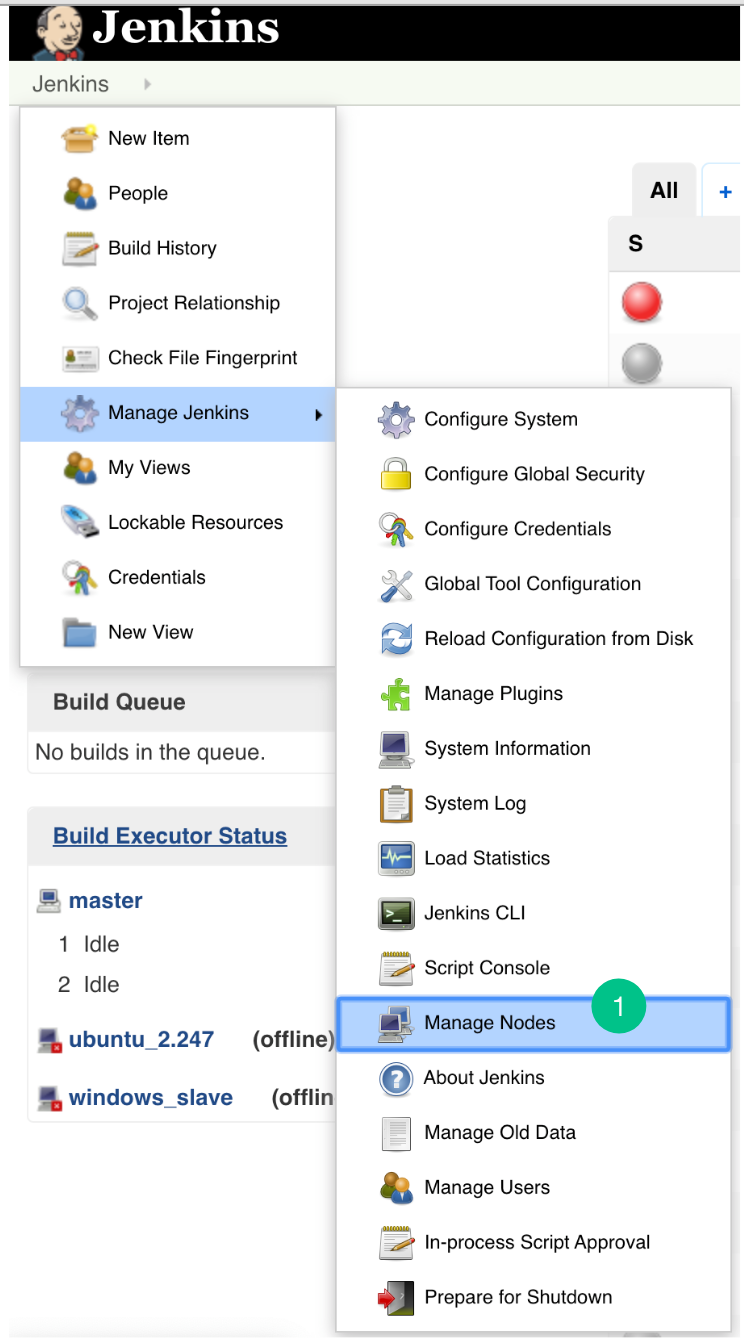
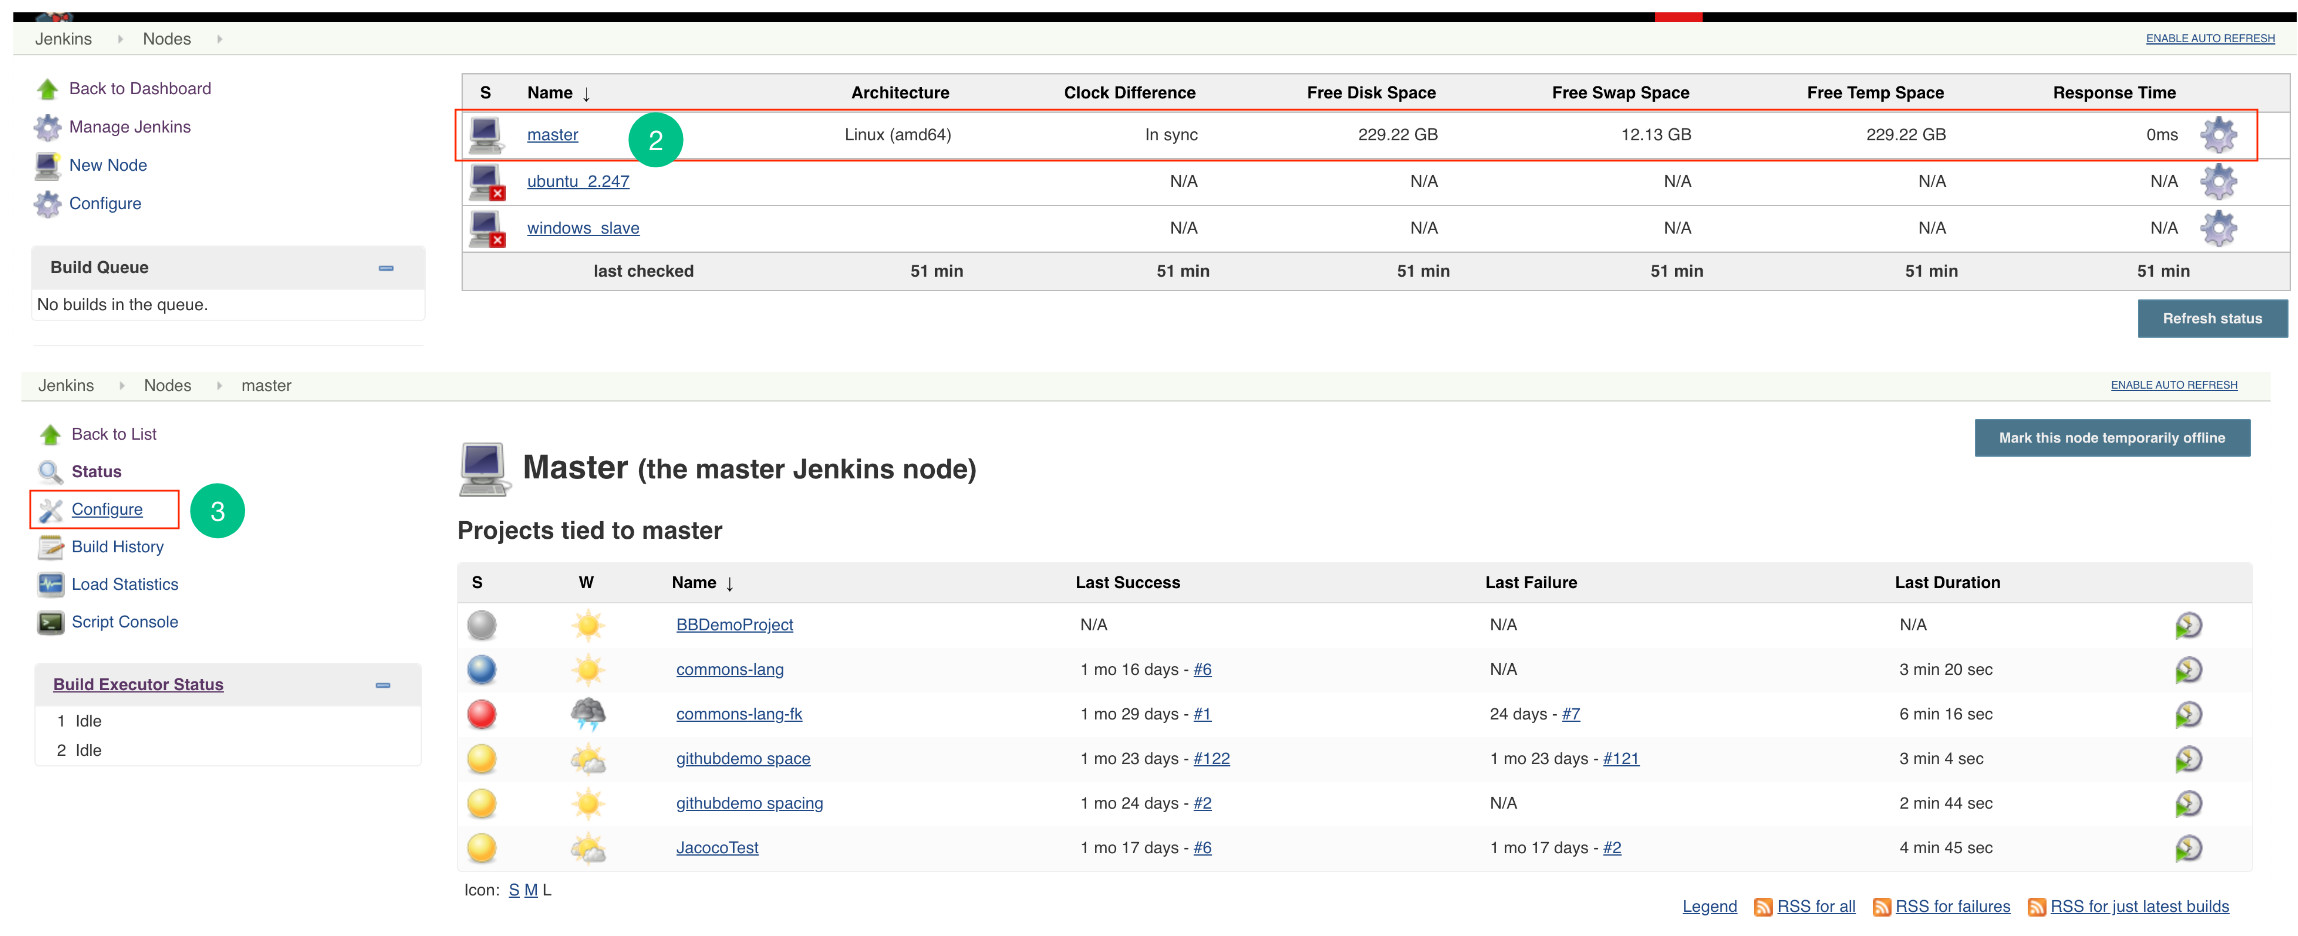
- Go to Jenkins -> Manage Jenkins -> Manage Nodes (only required for master – slave configuration)
- Open the particular Slave Node (only required for master – slave configuration).
- Go to Configuration.
- Add the new environment variables
CORONA_HOME,CORONA_LOGandEMBOLD_SCANNER_HOME.

Steps for master only
- Go to Jenkins -> Manage Jenkins -> Configure System page and add the following 3 environment variables in “Global properties” section (In a case of master slave add these variables into slave configuration)
- Add the environment variables
CORONA_HOME,CORONA_LOGandEMBOLD_SCANNER_HOME.CORONA_HOME: Specify the location where Embold Analyzer will be downloaded (e.g /opt/gamma/corona).CORONA_LOG: Specify the location where logs for Embold Analysis will be generated. Note: The directory should have write permissions.EMBOLD_SCANNER_HOME: Specify the path till embold-scanner.

Embold Quality Gate
Below are the steps to show Embold details as an HTML report on Jenkins:
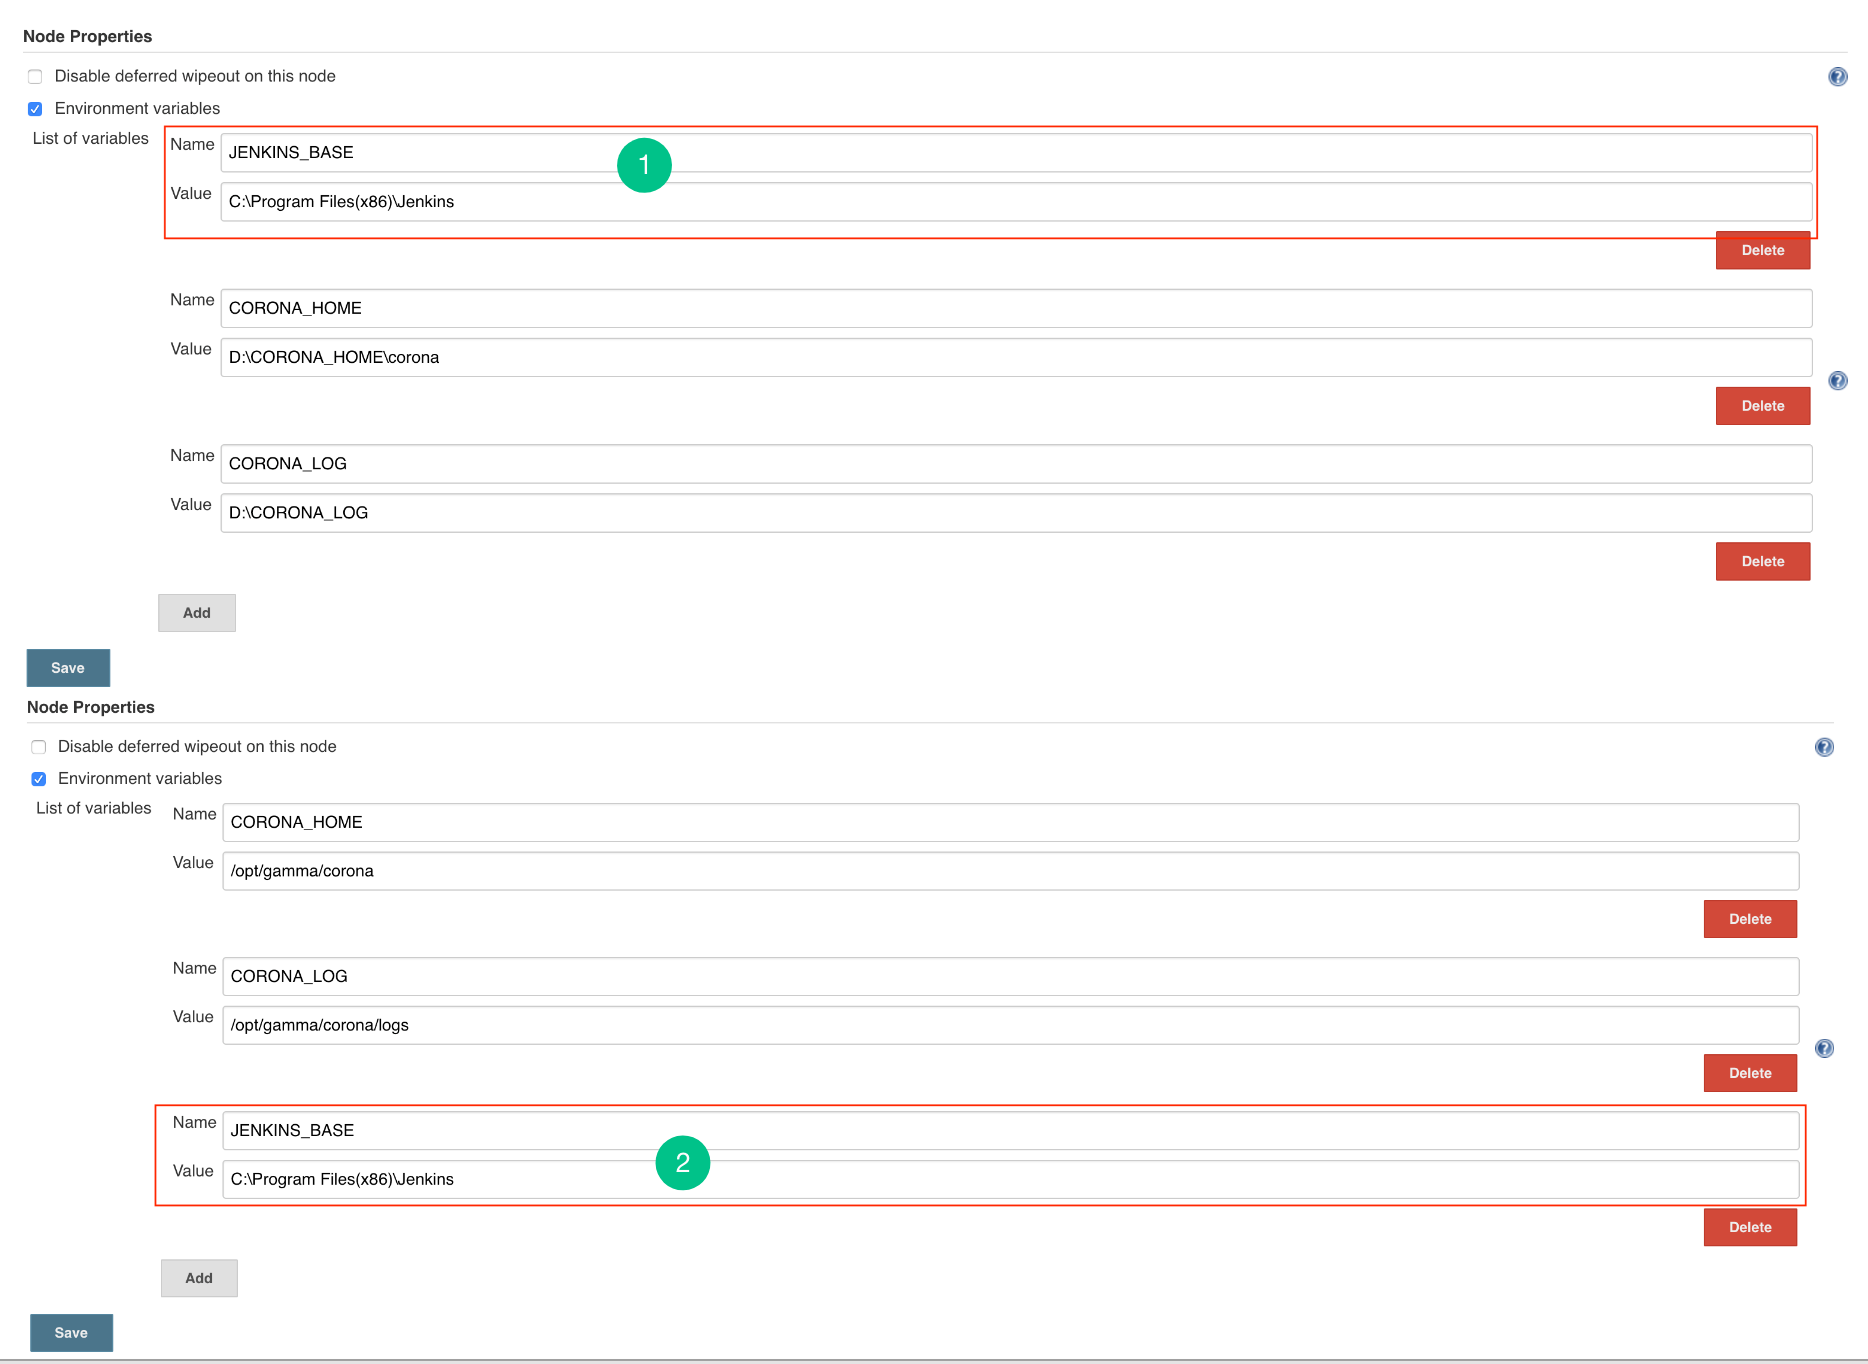
- Master Environment: Go to Jenkins > Manage Jenkins > Configure System and then add JENKINS_BASE environment variable in Node properties. Add path of Jenkins base directory of master’s machine.
- Master-Slave Environment: Go to Jenkins > Manage Jenkins > Manage Nodes > Click on the Configuration button of a particular node (slave) and then add JENKINS_BASE environment variable in Node properties. Add path of Jenkins base directory of master’s machine.
- Enable CSS and Javascript for Jenkins.
- Windows: add -Dhudson.model.DirectoryBrowserSupport.CSP=”” for Jenkins war in Jenkins.xml.
E.g.-Xrs -Xmx256m -Dhudson.lifecycle=hudson.lifecycle.WindowsServiceLifecycle -Dhudson.model.DirectoryBrowserSupport.CSP=”” -jar “%BASE%jenkins.war” –httpPort=8080 –webroot=”%BASE%war” - Linux: For Debian distributions, update the file- /etc/default/Jenkins.
- Centos/RedHat Distributions update the file /etc/sysconfig/Jenkins. E.g. JENKINS_JAVA_OPTIONS=”-Djava.awt.headless=true -Dhudson.model.DirectoryBrowserSupport.CSP=”””
- Windows: add -Dhudson.model.DirectoryBrowserSupport.CSP=”” for Jenkins war in Jenkins.xml.
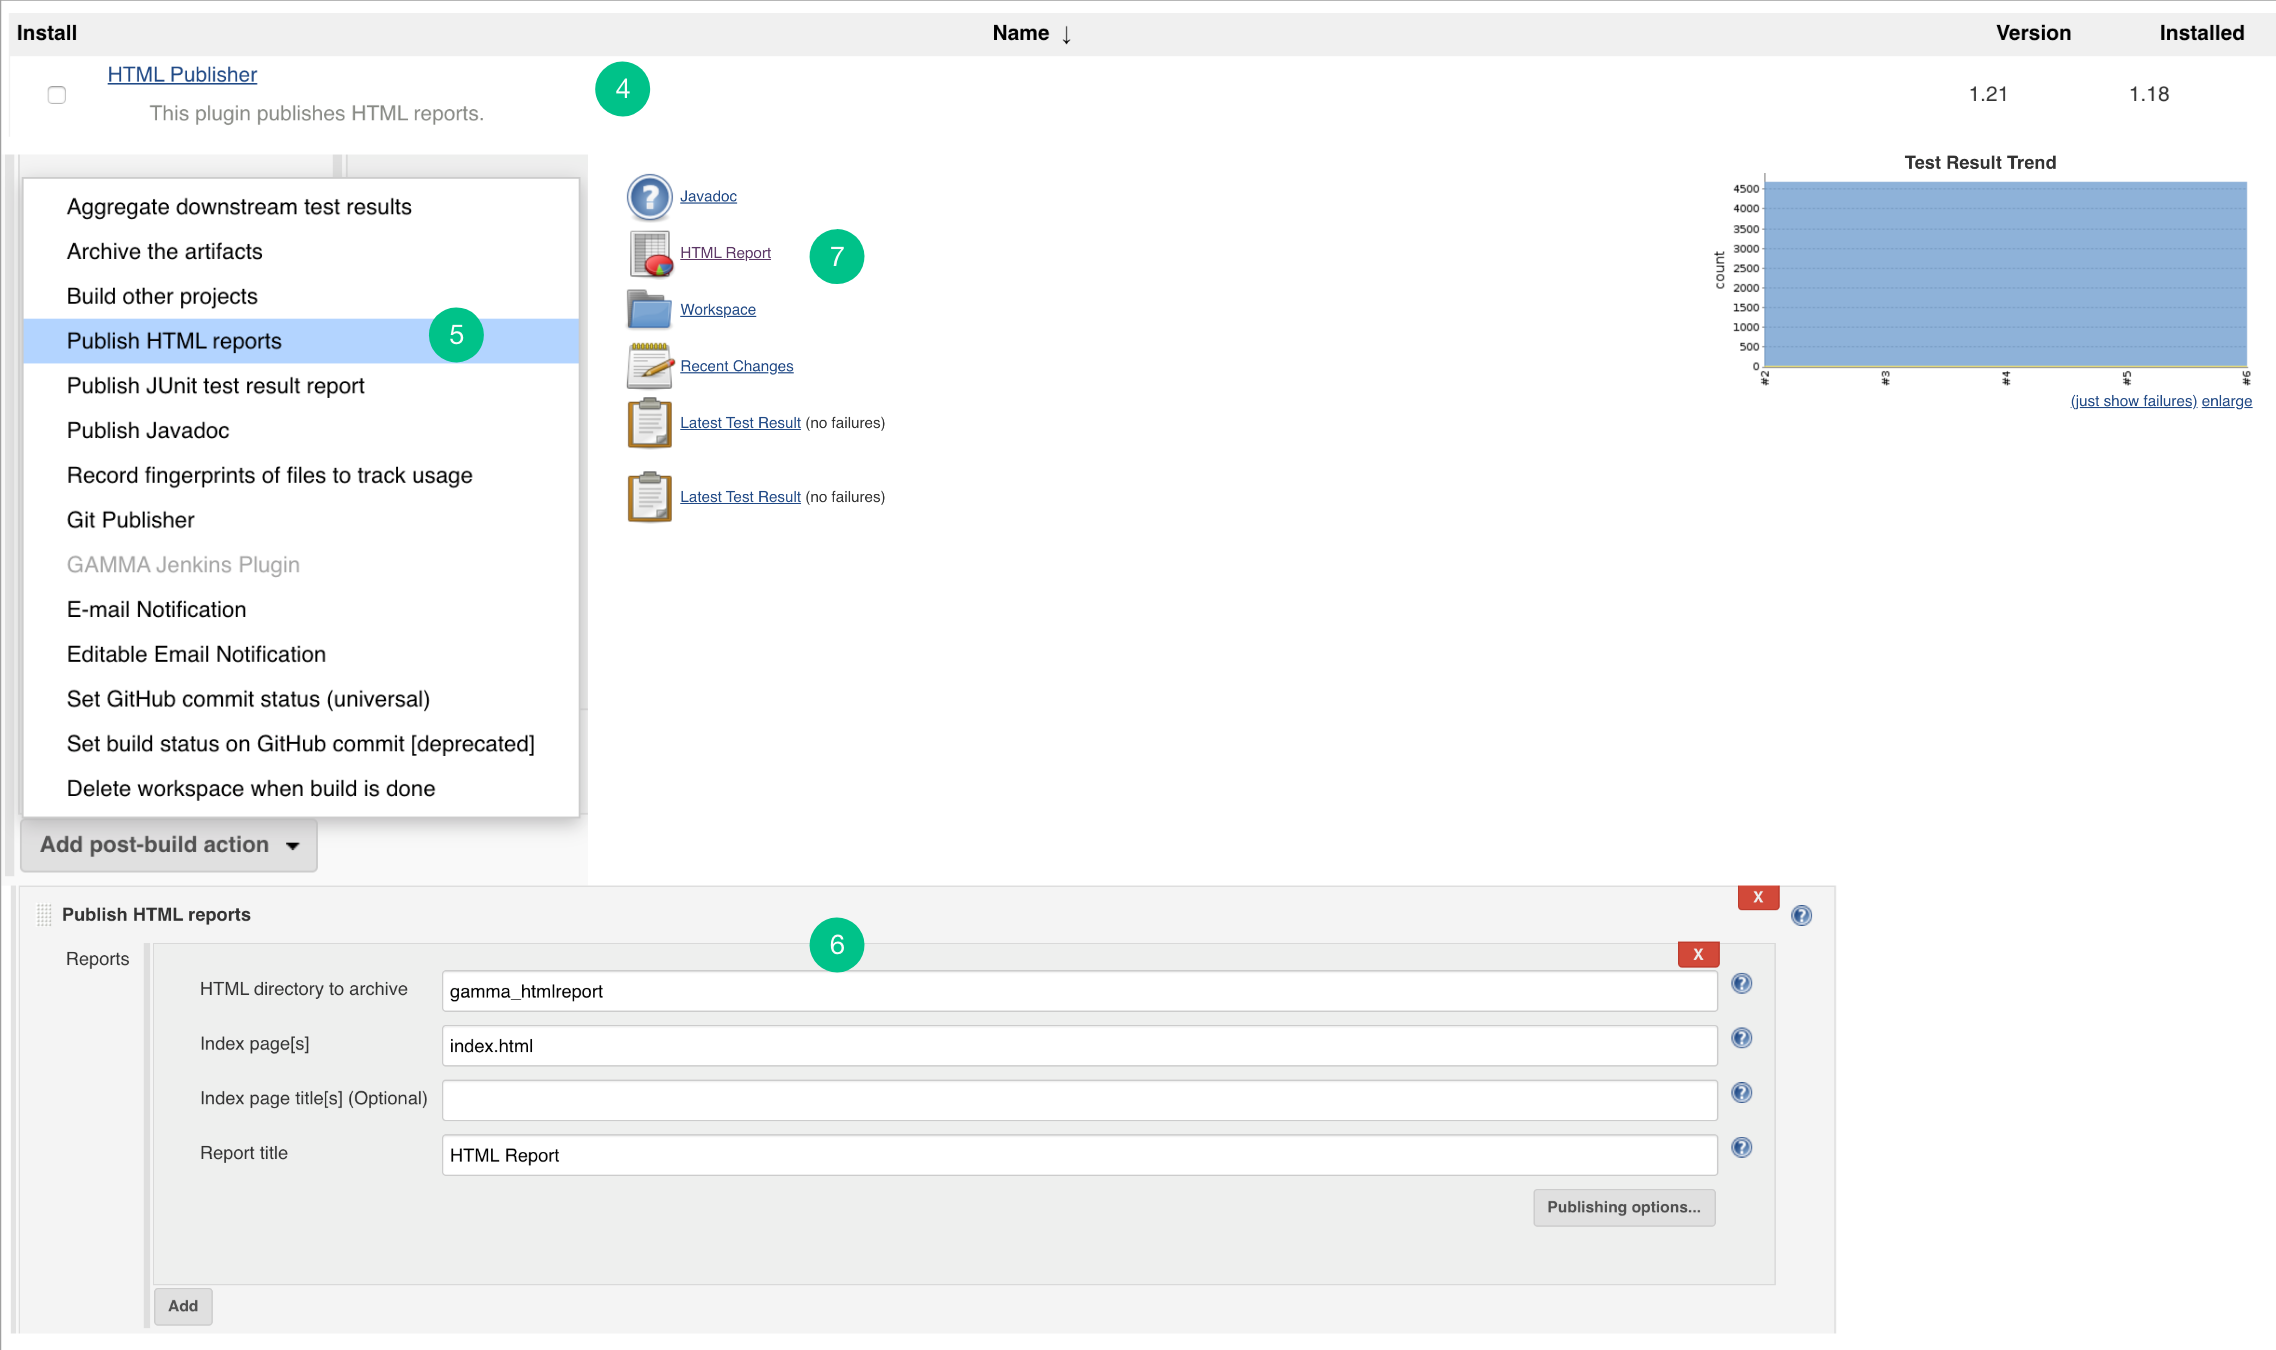
- Restart the Jenkins. Install HTML Publisher Jenkins plugin.
- Add a “Publish HTML reports” plugin. Make sure the HTML Publisher plugin should be executed/added after the Embold plugin.
- Add the required details in the HTML publisher configuration.
- After build success, you can check the HTML report into HTML Publisher.
Update Embold Jenkins Plugin
- Go to Jenkins -> Manage Jenkins -> Manage Plugins. In the Advanced tab, upload the latest embold-jenkins-plugin.hpi file.
- Restart Jenkins using http://
/safeRestart.
SonarQube Integration
SonarQube integration with Embold allows users to see code issues reported by SonarQube on Embold.
Prerequisites
- Make sure Sonar analysis for a particular project is completed and code issues are visible on Sonar UI.
Steps for Integrating SonarQube with Embold
The following are the steps for running the SonarQube module with Remote Analysis:
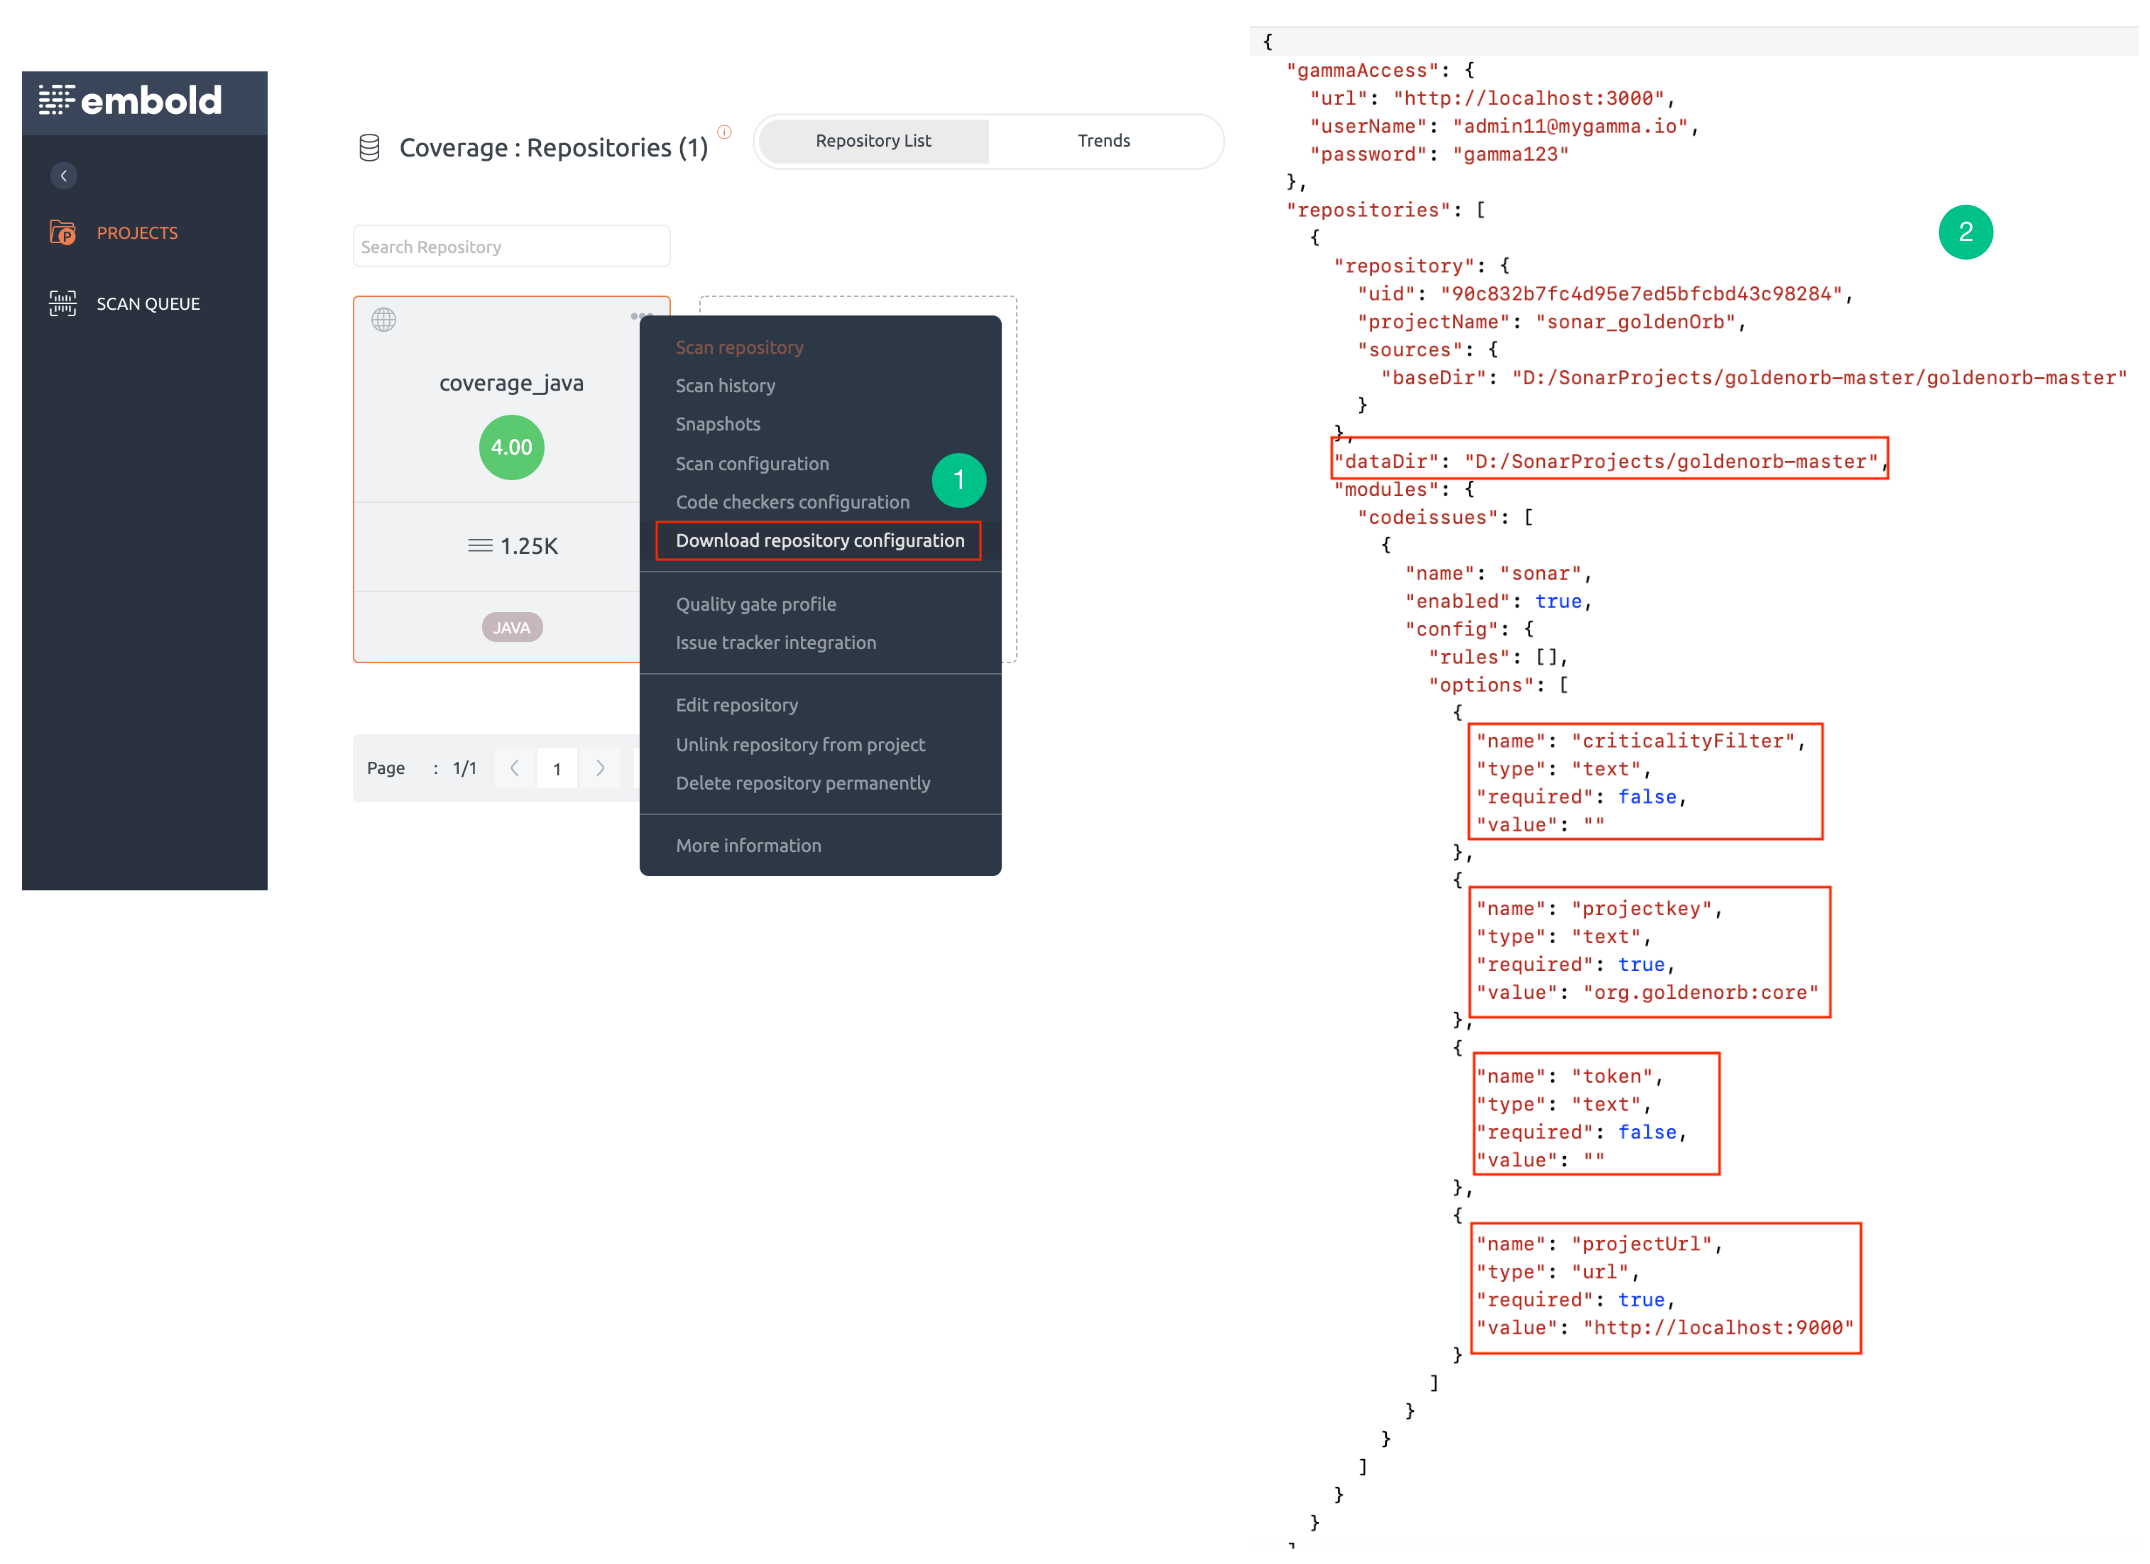
- Download the JSON file from Embold. To know more about downloading configuration JSON from Embold UI, click here.
- Add the following config parameters for the SonarQube module in the code issue section.
- Specify the “Sonar User Token” for authentication.
- Specify the URL where SonarQube is running. This is a mandatory field.
- Specify the unique Sonar project key. This is a mandatory field.
- Specify one or more severities for which code issues will be fetched from SonarQube. If not specified, code issues for all the severities will be retrieved.
Example: SonarQube default severity values are: BLOCKER, CRITICAL, MAJOR, MINOR and INFO.
Configuration Notes
- Criticality filter value can contain custom severities or can be blank.
- Example: criticalityFilter=”blocker;severe;medium”
Note: Values should be separated using semicolon (;).
Mapping between SonarQube and Embold severity
| Sonar | Embold |
|---|---|
| Blocker | Critical |
| Critical | High |
| Major | Medium |
| Minor | Low |
| Info | Info |
TeamCity Integration
TeamCity is a user-friendly Java-based build management and continuous integration server. Embold plugin integrates with TeamCity to:
- Automatic code scan upon triggered builds.
- Upload project’s code to Embold with scan results
- Embold tab to view scan summary and trends.
Prerequisites
- For seamless installation and execution, Embold should be installed on a clean Machine/VM.
- Install standalone corona on build machine (master/node).
- Requires an account to sign in to Embold from the browser. Please contact the administrator to create an account.
- Download file from your Embold Account’s section > Releases tab > Plugins > CI_CD > teamcity. There will be a file with a name similar to the following: embold-teamcity_1.8.3.0.zip.
- Embold uses the configuration file ‘.gammascan.json’ while analyzing the project. This file should be a part of the project to be analyzed.
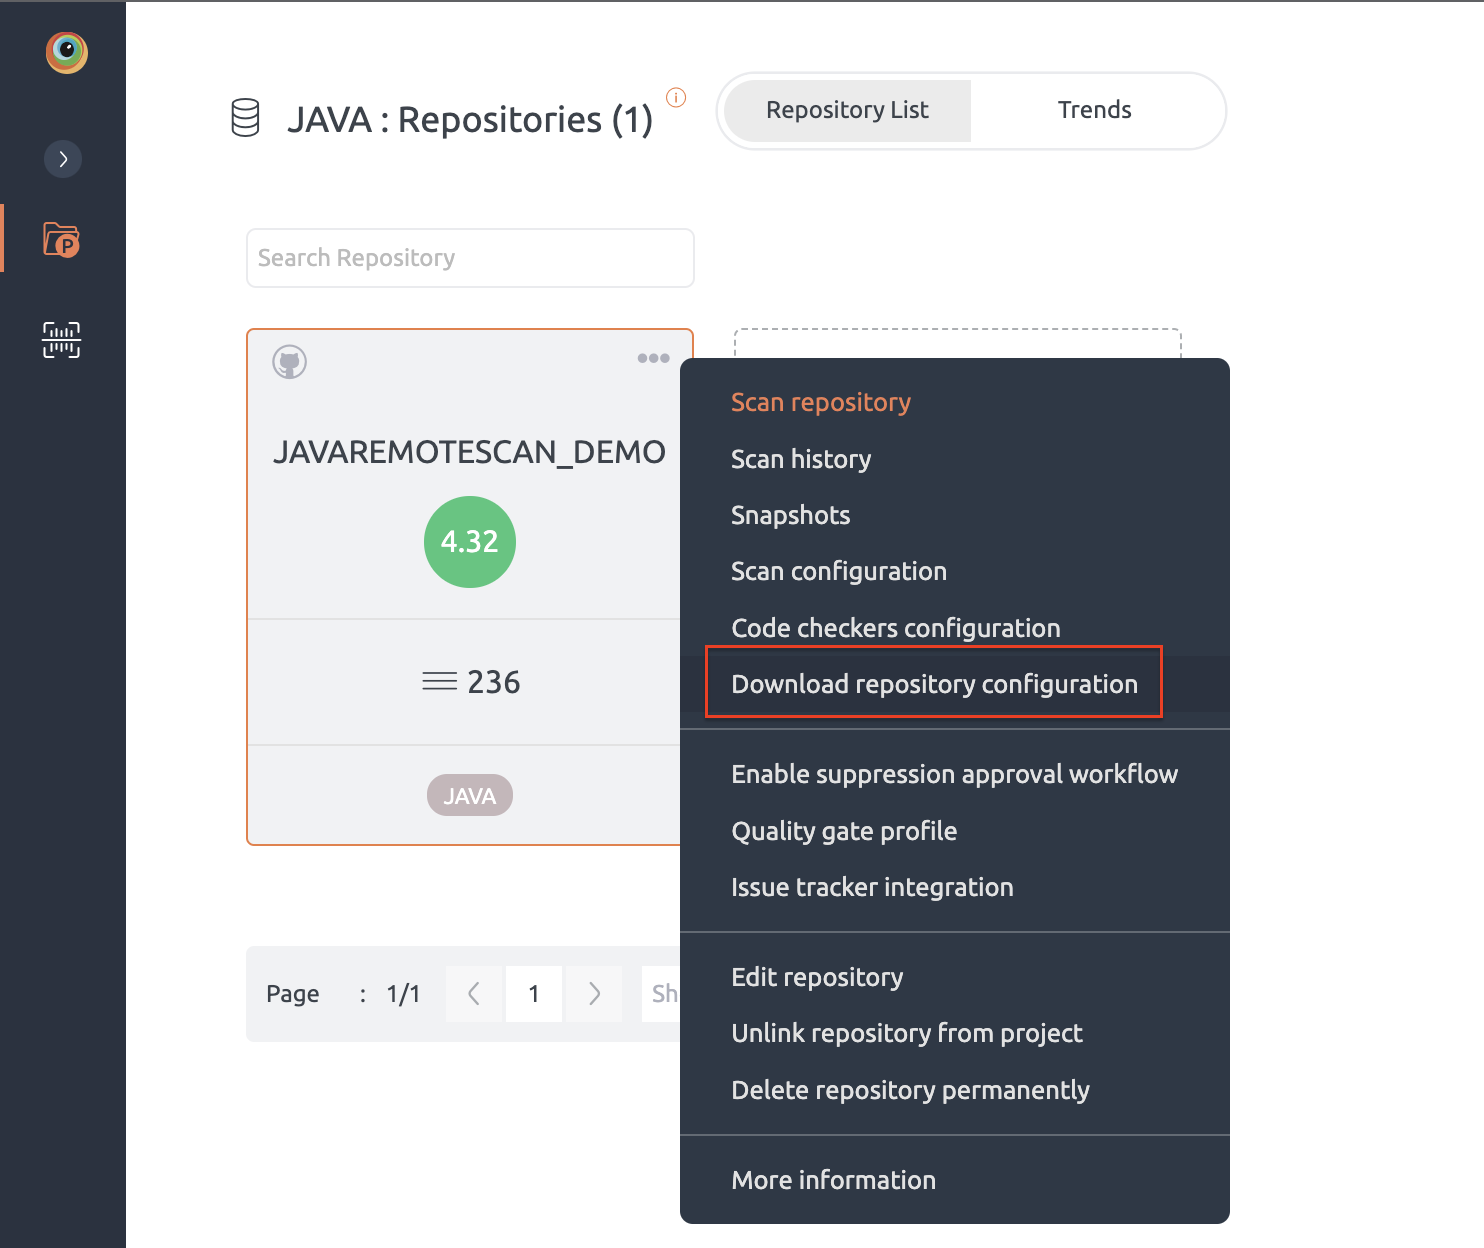
- You can download configuration JSON from Embold UI.
Installation Steps
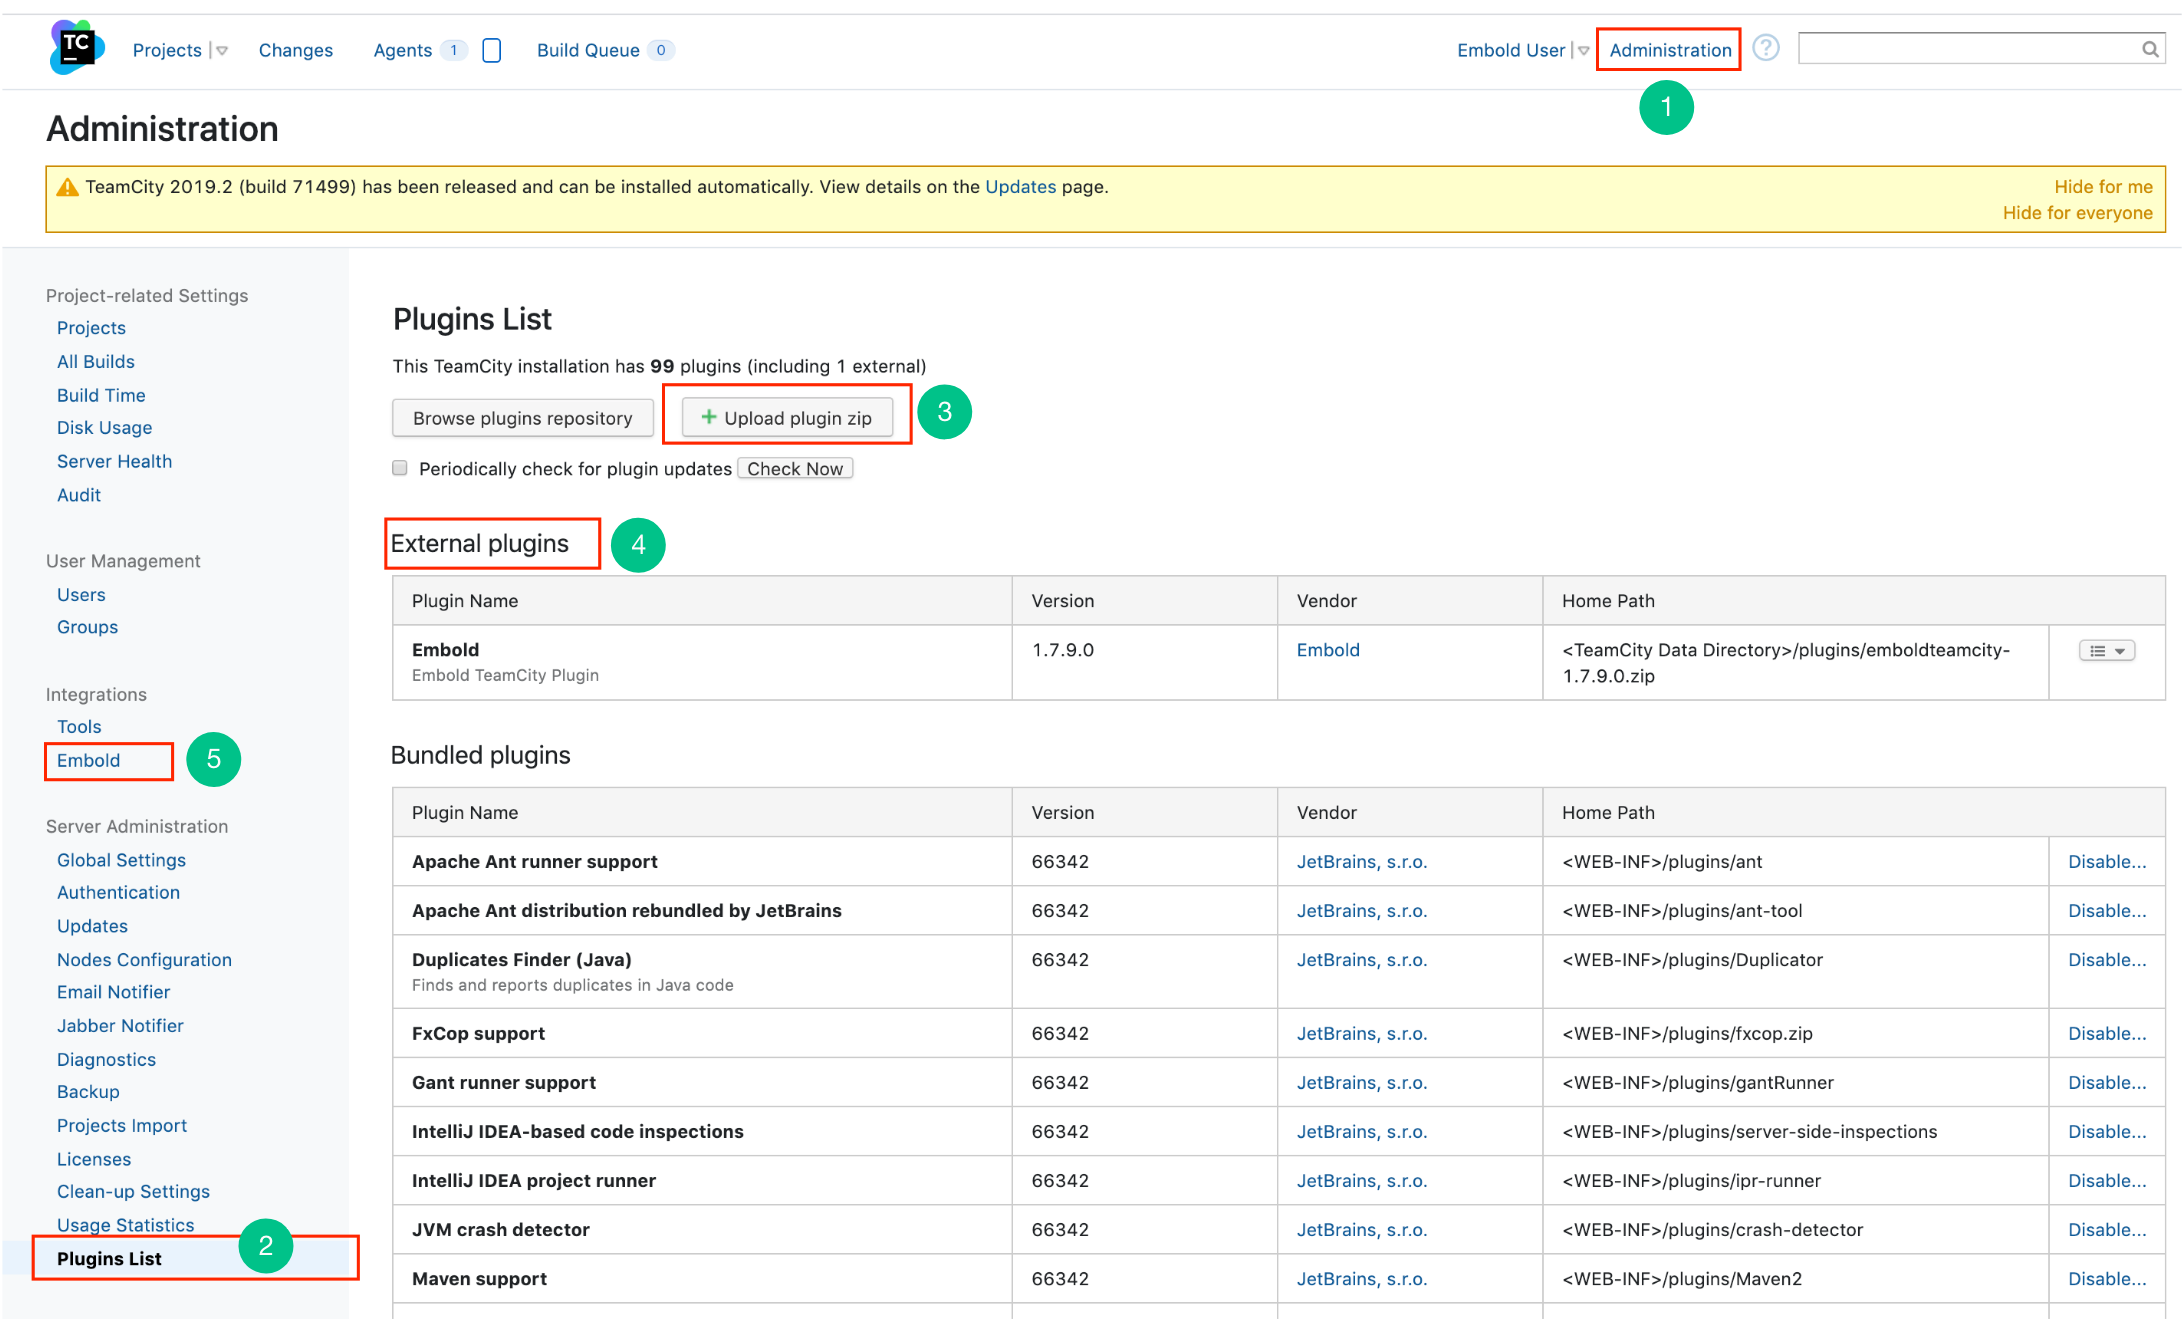
- On the top right corner of the TeamCity home page, click Administration.
- On the left navigation panel under Server Administration, click Plugin List.
- On the Plugin List page, click Upload plugin zip. Upload the downloaded plugin.
- On successful uploading, Embold plugin is listed in the External plugins table.
- Go to the Home page. On the left navigation pane, click Embold to validate the user.
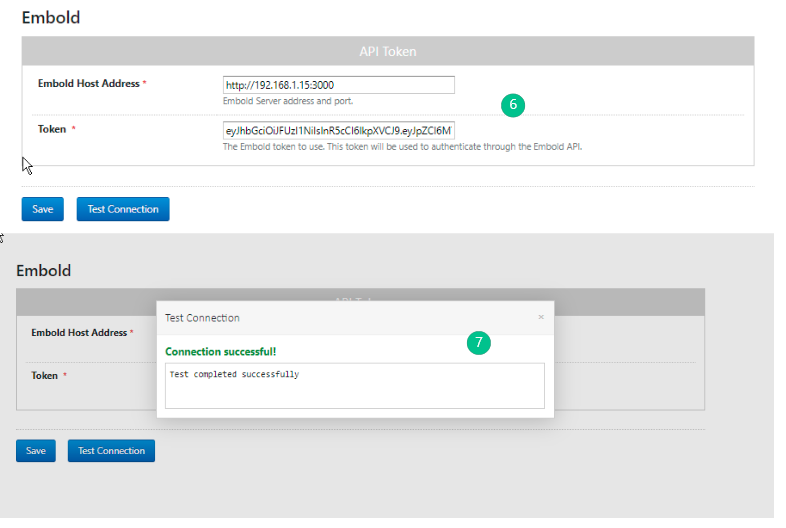
- Embold can be validated using either API token, then click on the Test Connection button.
- On successful validation, the “Connection successful” message is displayed.
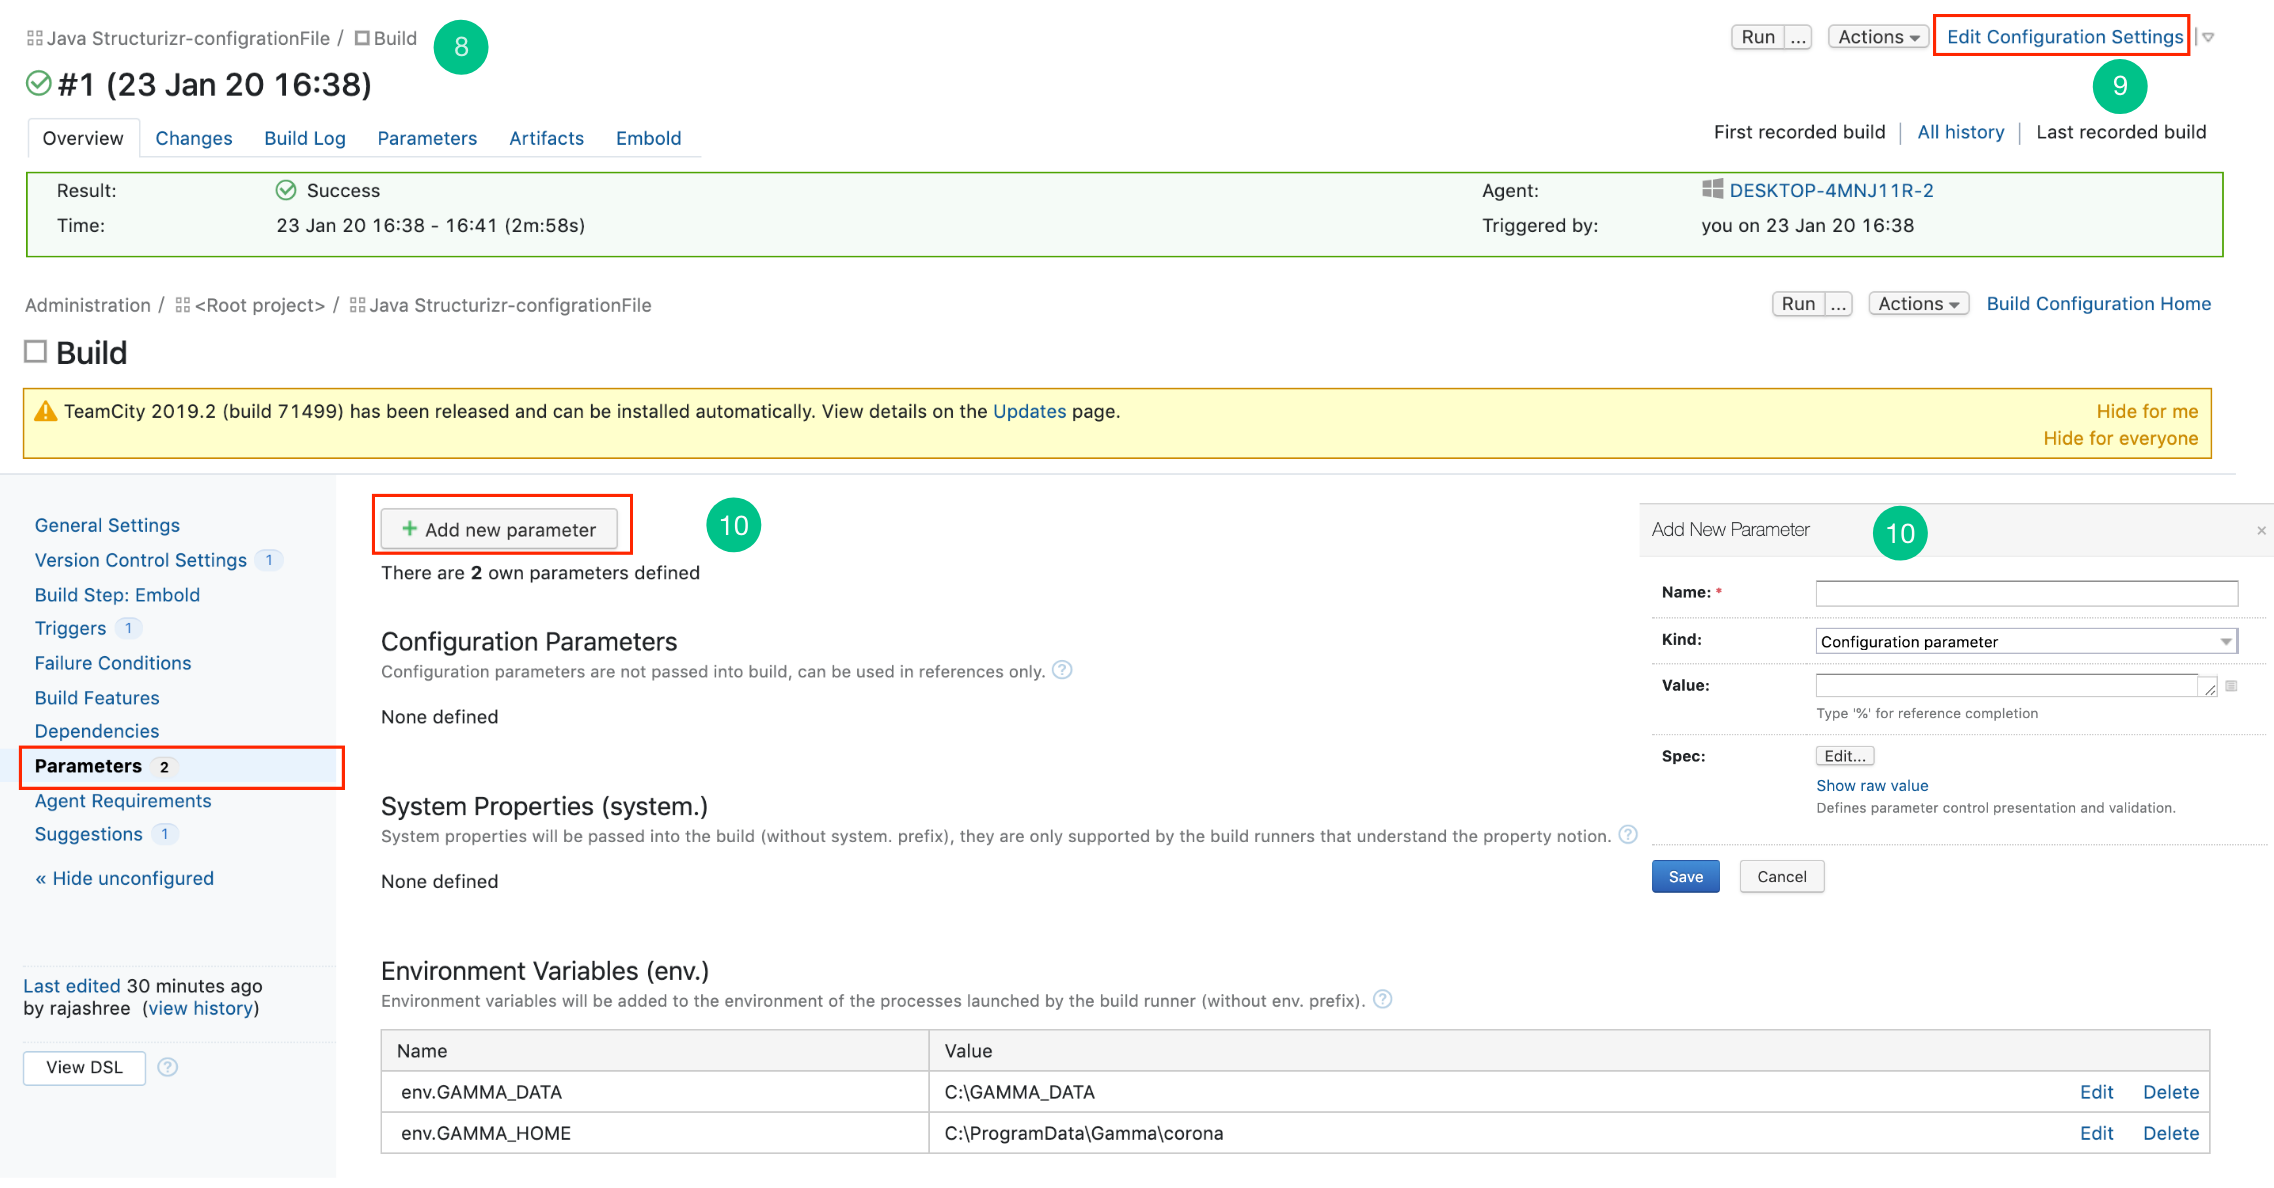
- Click on the project and build that needs to be analyzed through Embold.
- Click on the Edit Configuration Setting of the build.
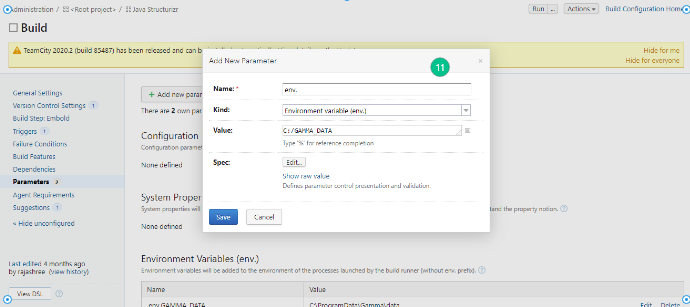
- On the left navigation pane, click Parameters > Add new parameter.
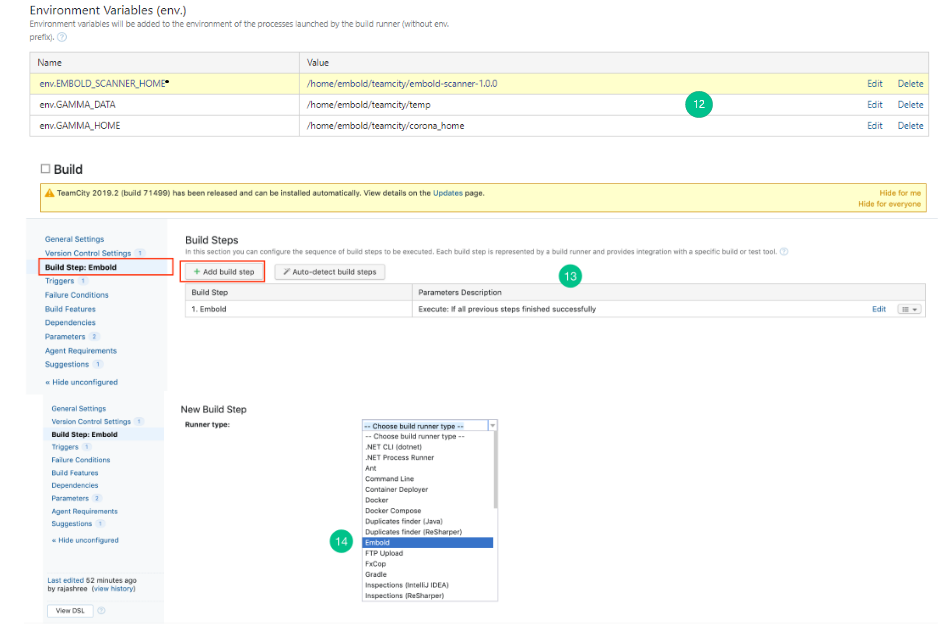
- Add the environmental variables env.GAMMA_HOME, env.GAMMA_DATA and env.EMBOLD_SCANNER_HOME. Click Save.
-
env.GAMMA_HOME: Specify the location where corona is installed (e.g /opt/gamma/corona) env.GAMMA_DATA: Temporary directory location. (Used to store temporary data created while analyzing repository). Note: The directory should have write permissions.env.EMBOLD_SCANNER_HOME: Specify the location for scanner home.
-
- The environmental variables are added successfully.
- Go to the left navigation pane, Click Build Step: Embold > Add build setup.
- Choose EMBOLD from the build runner drop-down list.
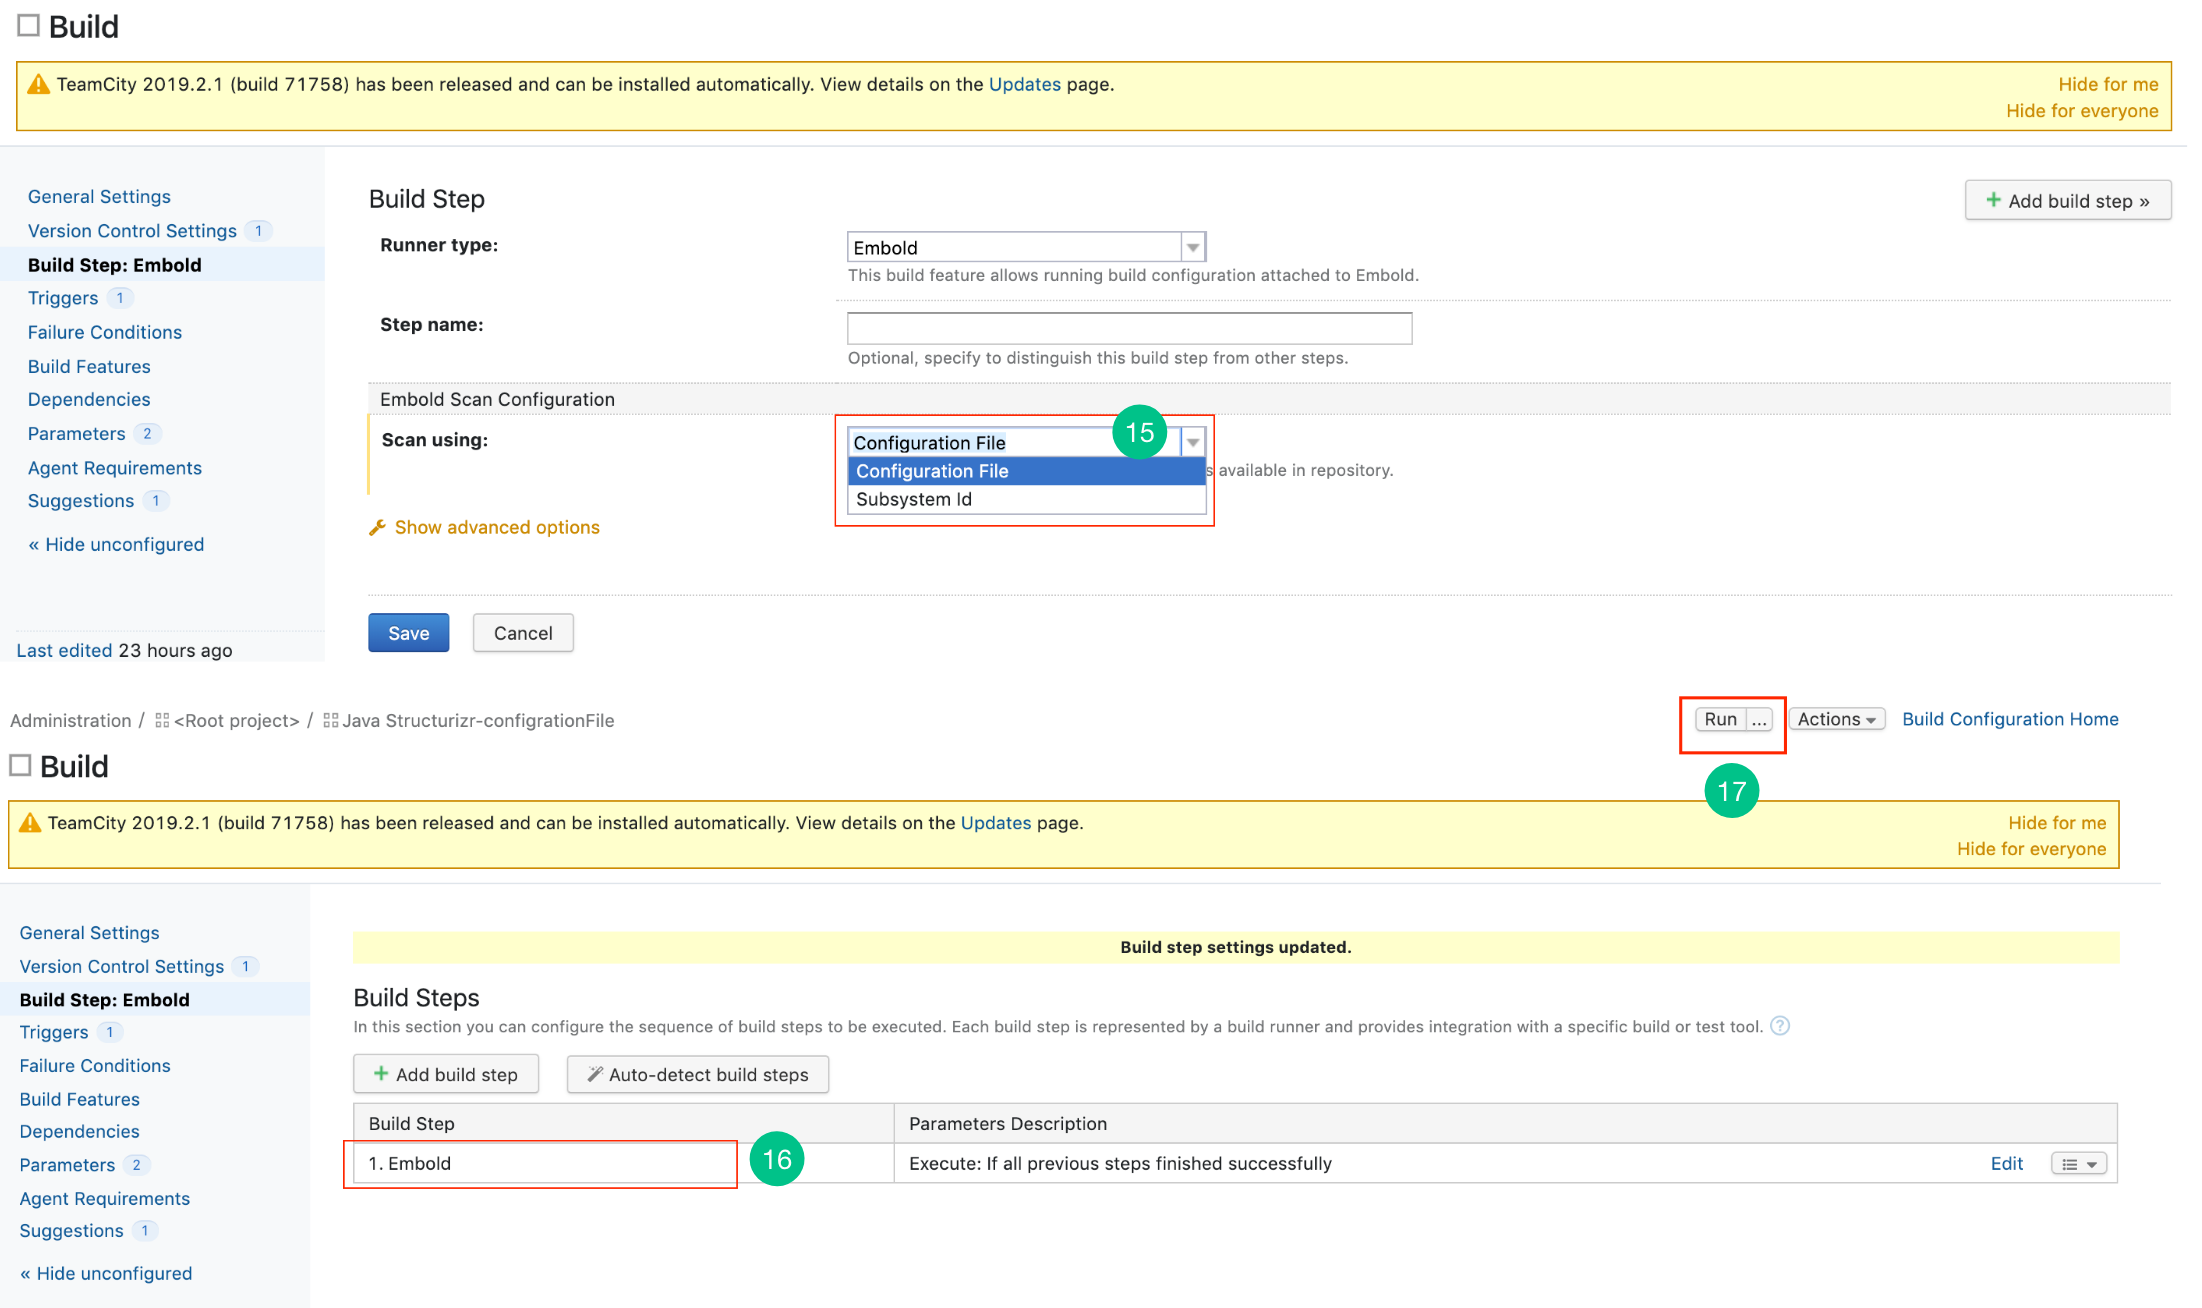
- There are 2 options through which scanning can be done:
- Using Configuration File: Configuration file can be obtained from Embold and need to be uploaded here.
- Using Subsystem ID: Obtain Subsystem ID from Embold.
This step is optional if the user wants to run the scan using Subsystem UID.
- You have successfully added a new Embold Built setup.
- Click on the Run button to build the project.
- After building the project, click on the Overview tab to view the result, Artifacts tab to view the generated PDF and Embold tab to view the analyzed project in a graphical format.
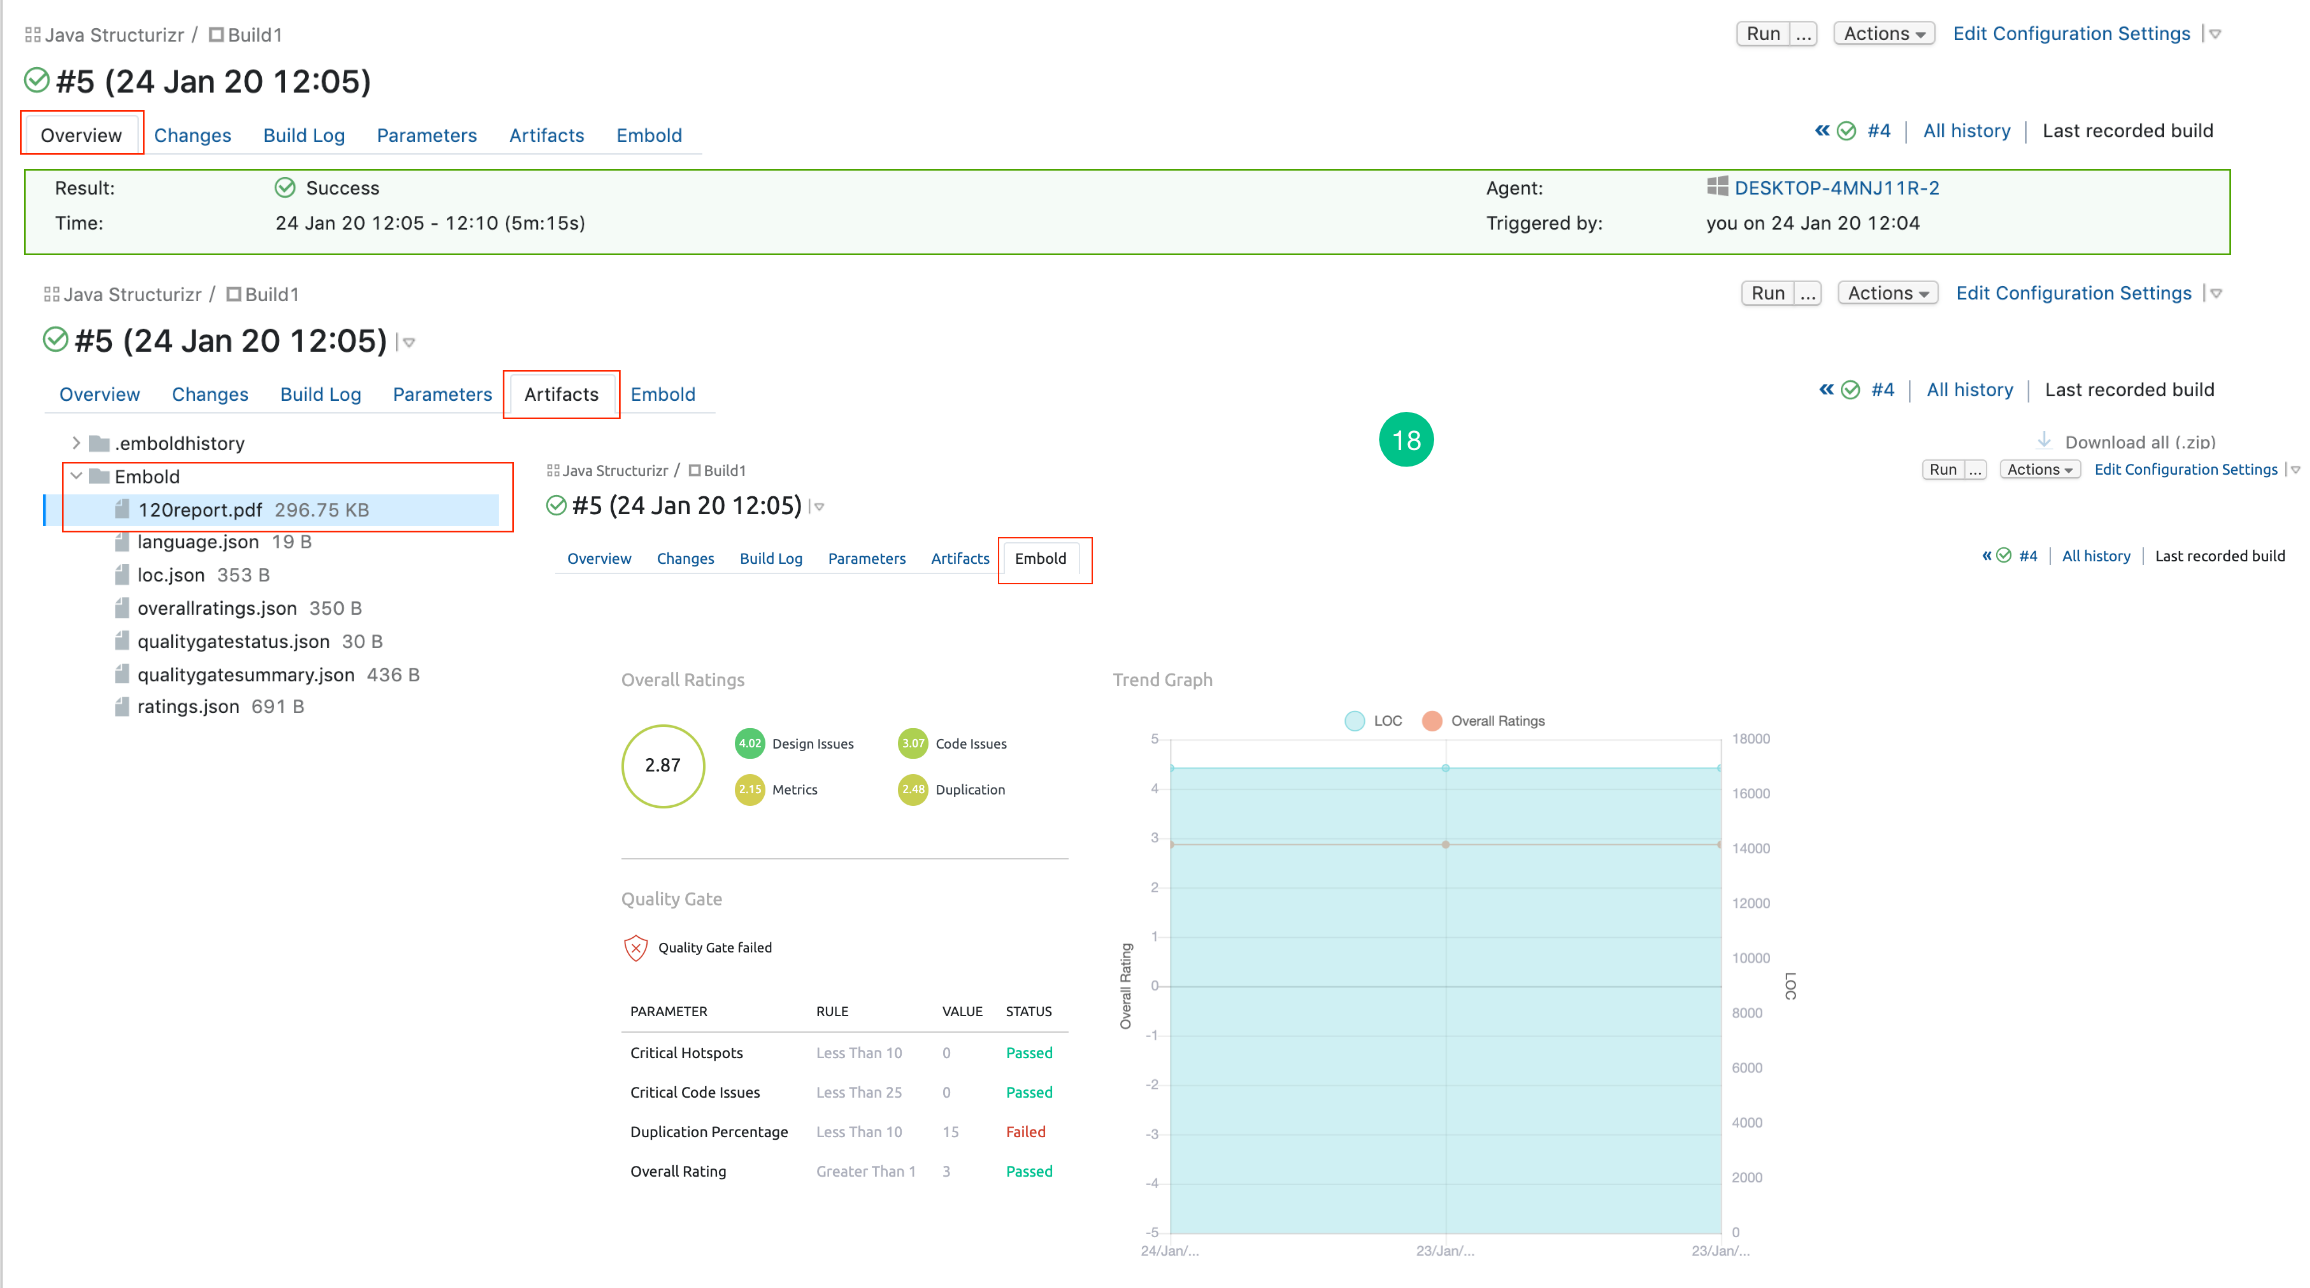
IDE Plugins
Embold IDE plugin allows developers to scan their code locally within the IDE environment and find issues in code as it is developed, before committing it to version control systems. Developers can install Embold IDE Plugin in their local eclipse/VS installation. The plugin requires sign-in with the Embold server deployed within the organization. It supports both windows and Linux OS.
Eclipse Plugin
Prerequisites
- Eclipse versions supported by Embold Eclipse Plugin are Mars, Neon, Oxygen.
- Requires a valid Embold username and a password. This is the account you usually use to sign in to Embold from the browser. If you don’t have one, please contact the administrator to create an account for you.
- Requires Eclipse CDT plugin
Installation Steps
- Download file from your Embold Account’s section > Releases tab > Plugins >IDE > eclipse. There will be file with a name similar to the following: site.zip.
- Extract zip file at any location
For e.g : /Users/admin/Embold/Site - Go to “Help” -> “Install new software”
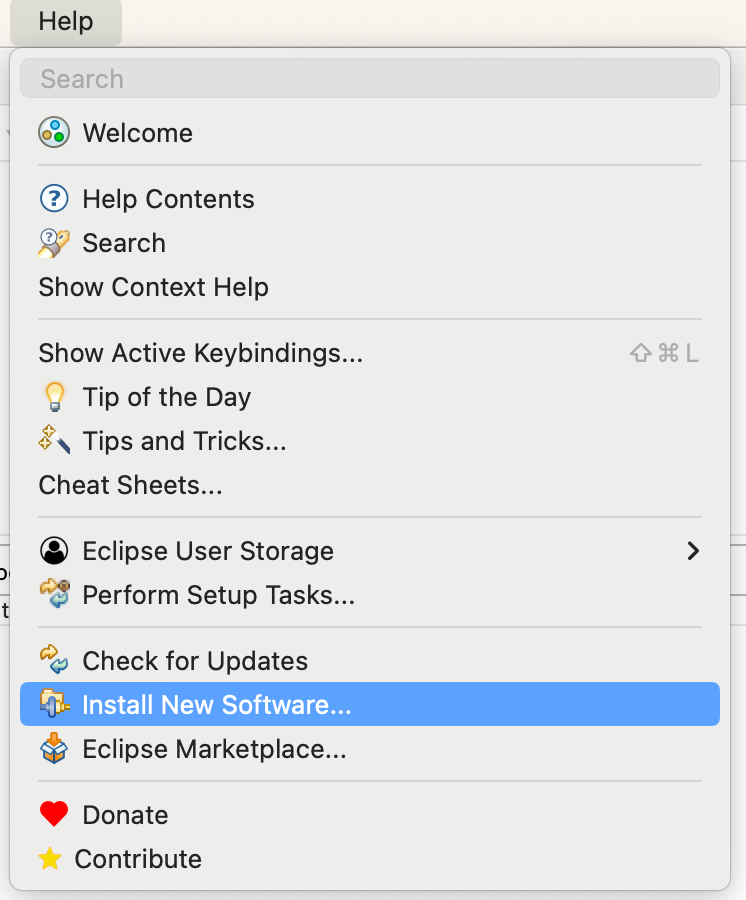
- Click on “Add” button
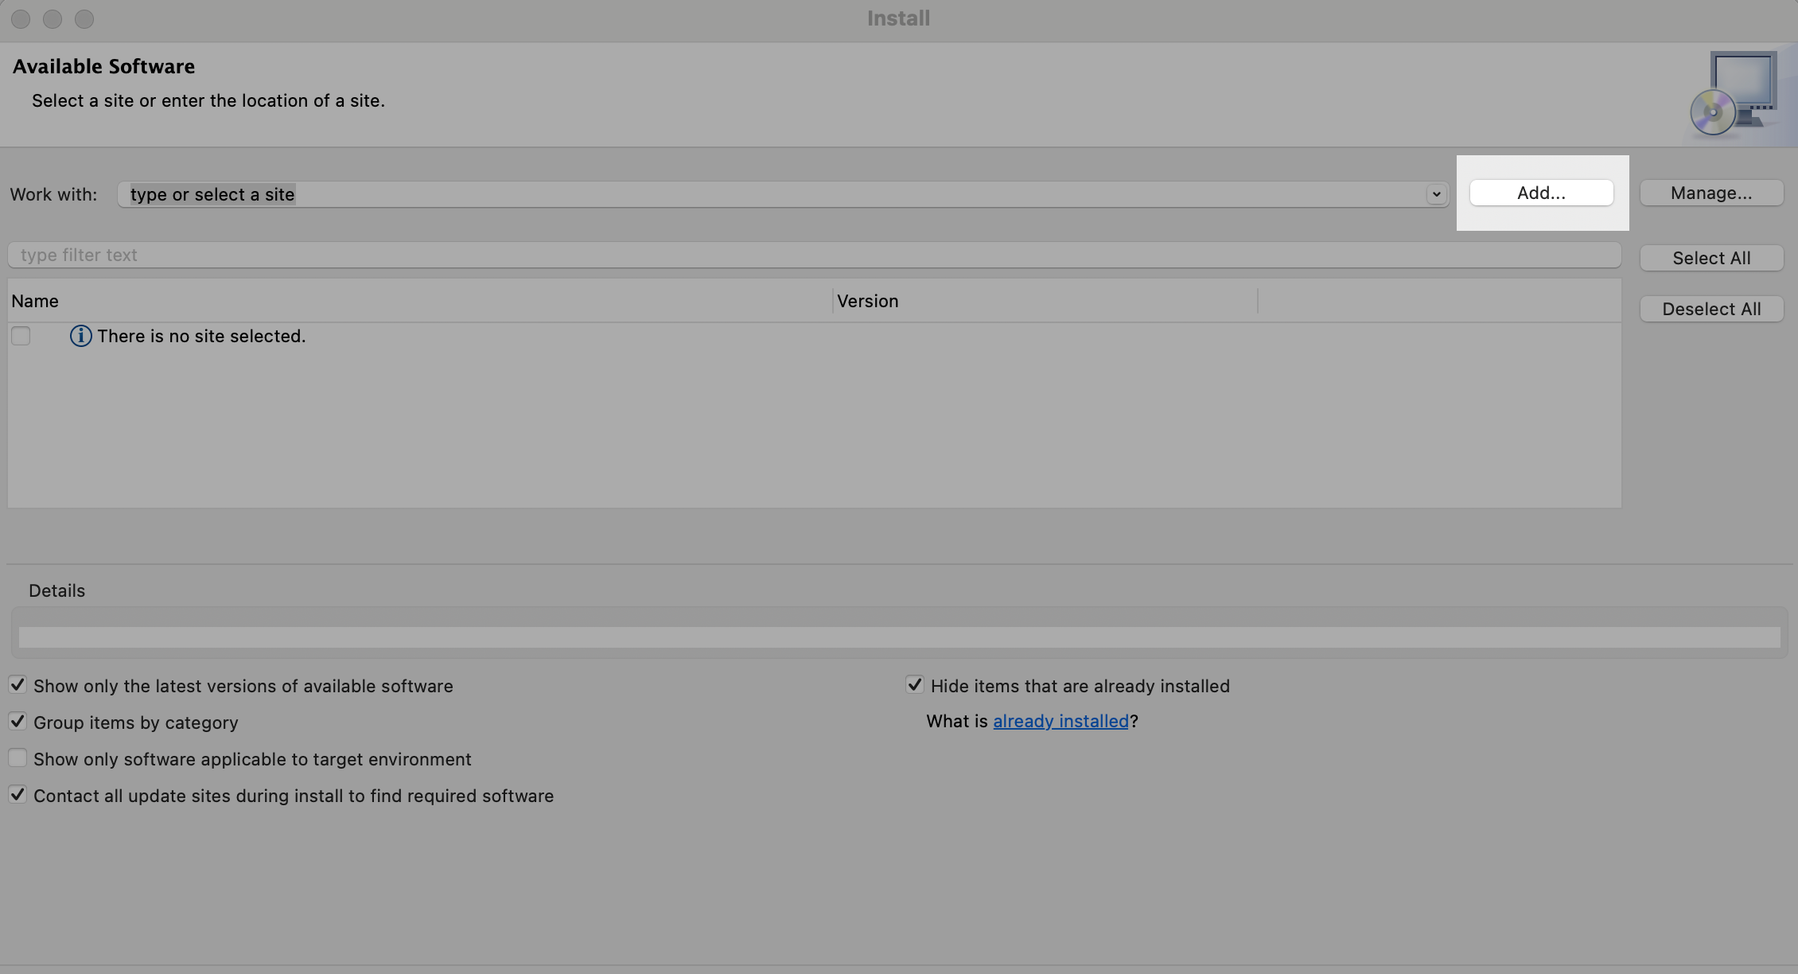
- Click on local button.
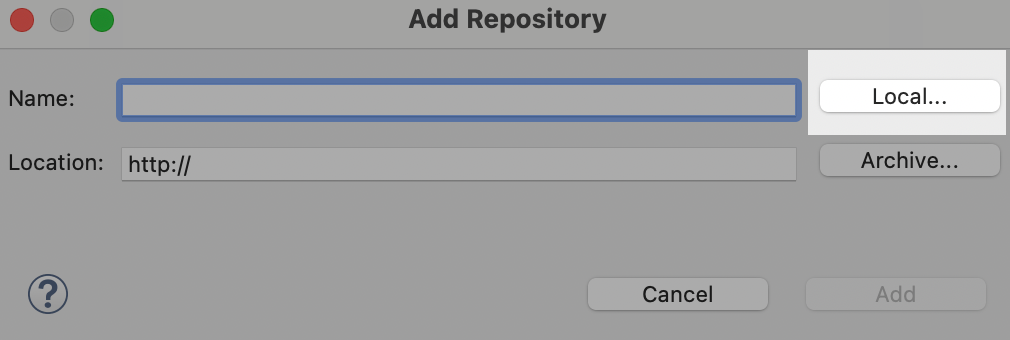
- Browse parent dir of extracted zip.
- Click on Add.
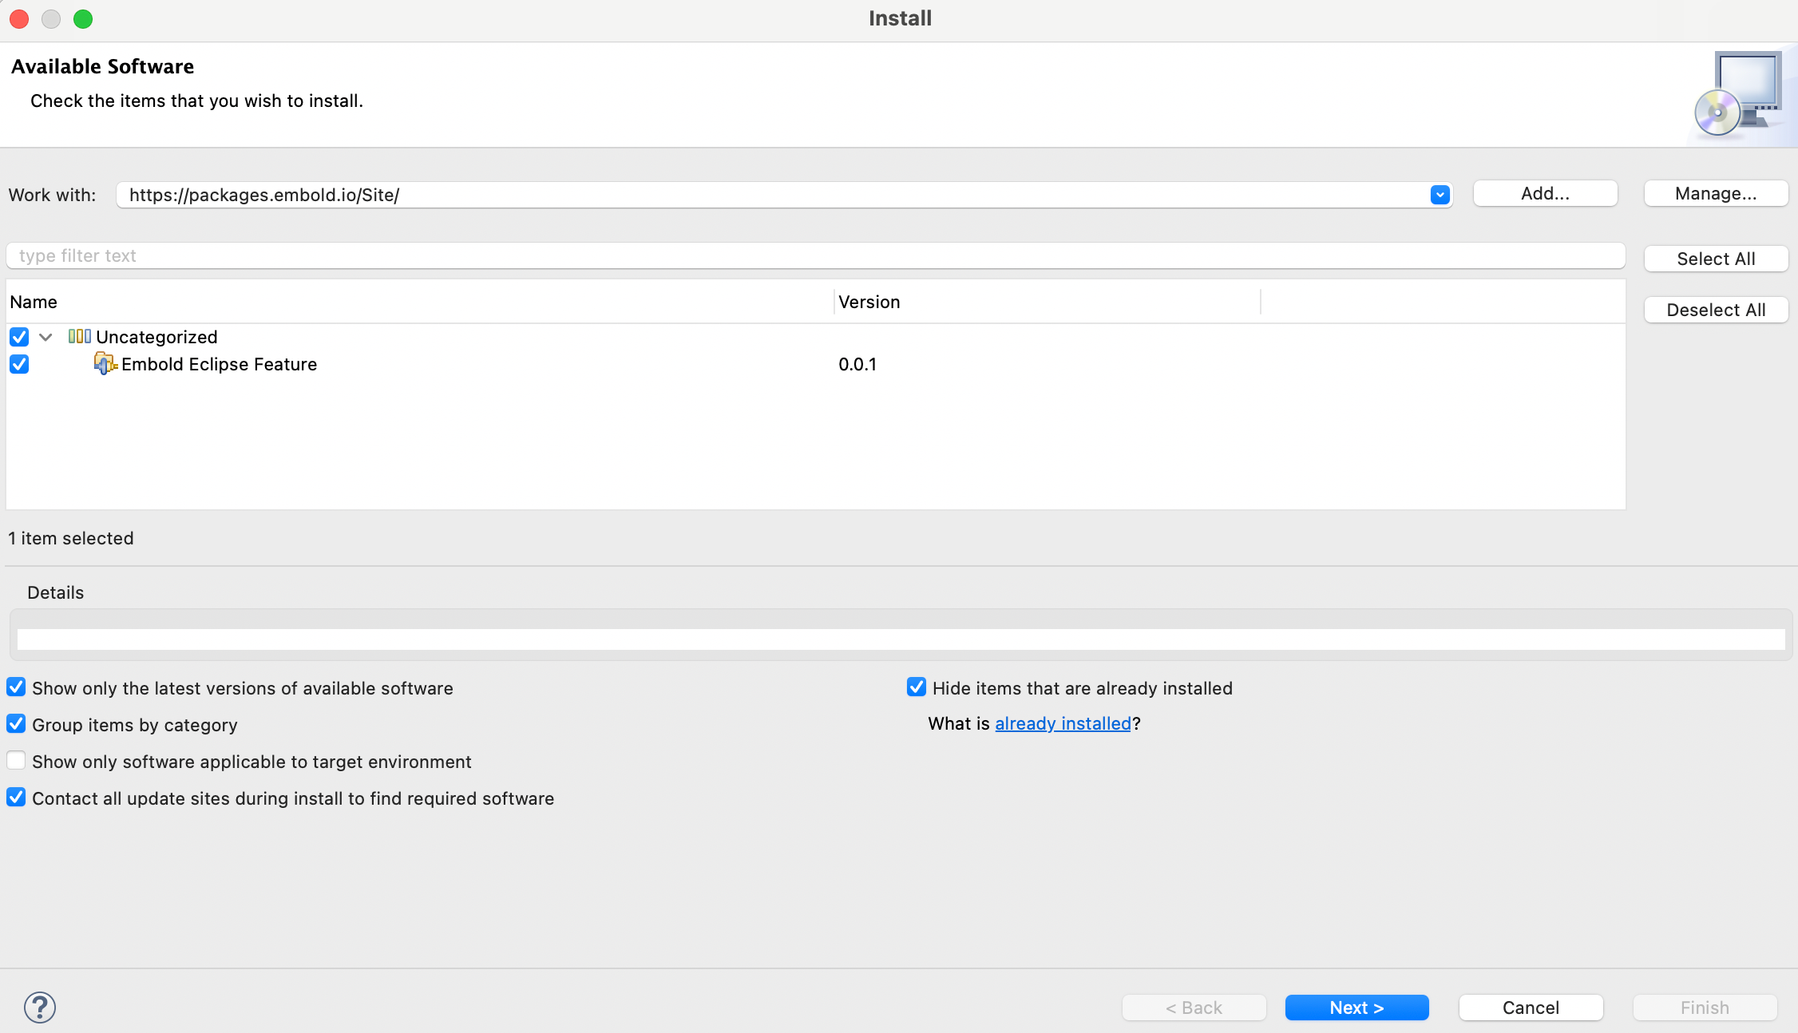
- Check the “Embold Eclipse Feature”
- Accept ‘Terms and conditions’
- Finish and Restart Eclipse
- Enable the Embold Analysis tool in the menu bar (After restarting Eclipse): Go to Window -> Preferences > Embold settings.
- Configuration setup and authentication process:
- Contact the administrator to get Embold the URL.
- Enter the Embold Authentication Token.
- Validate the Embold credentials and click on ‘Apply and close’ button.
- After authentication, Go to Embold Settings > Scan Configuration option. Select language and modules to run (e.g. CPPCheck for CPP).
- Click on Embold analysis icon from the menu bar to run analysis.

Embold UI Result Retrieval Options
For retrieving result from Embold UI server perform the following steps
- Go to
Embold settings. - Click on Server Configuration.
- Now select
Get issues from servercheckbox. - Enter repo UID.
- Click on
Verify Repo UID. - Click on
Apply and Close.
- Click on Embold analysis icon from the menu bar to run analysis.
Analysis of output
Note: Requires CPPCheck version 2.4 to be installed for CPP analysis. Set CPPCheck in the environment variable. Verify if the environment variable is set or not by typing ‘cppcheck –version’ on the command line.
After running an analysis successfully, view the results with the help of following views on Eclipse. These views can be opened as follows:
- Click on Window -> Show View -> Other.
- Open Embold -> Click on Embold related views
(e.g. Component Report View, Hotspot View, and Component Info View):
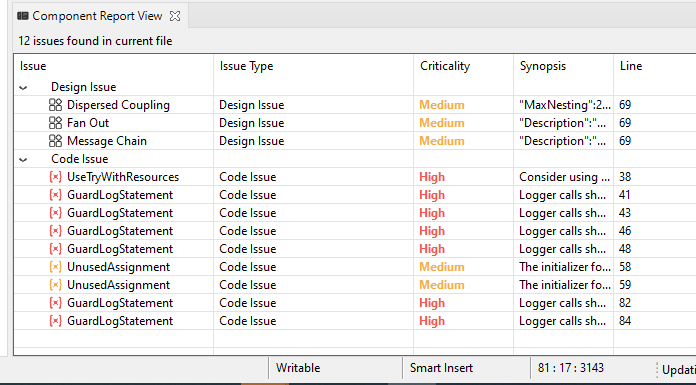
- Component Report View:
This view gives you all the code issues and design issues for the currently opened file (Java/CPP) in the editor.
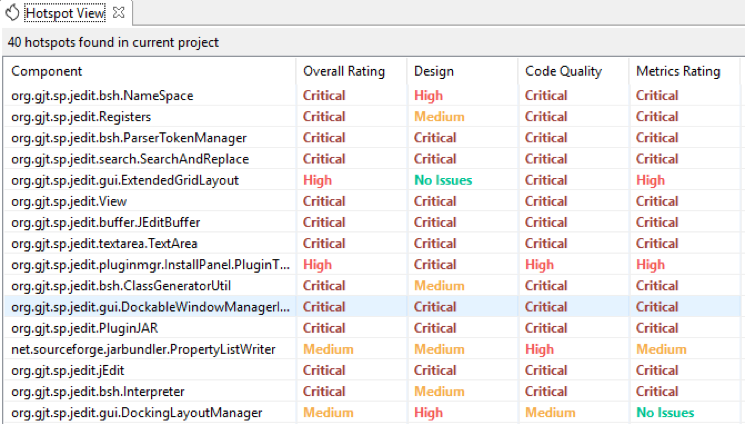
- Hotspot View:
This view shows all the Hotspots in the project.
- Component Info View:
This view opens when you right click on any code issue or design issue and click on Show info option, it gives you information related to any code issue or design issue.

- Design Issue Info (God Class)

- Code Issue Info
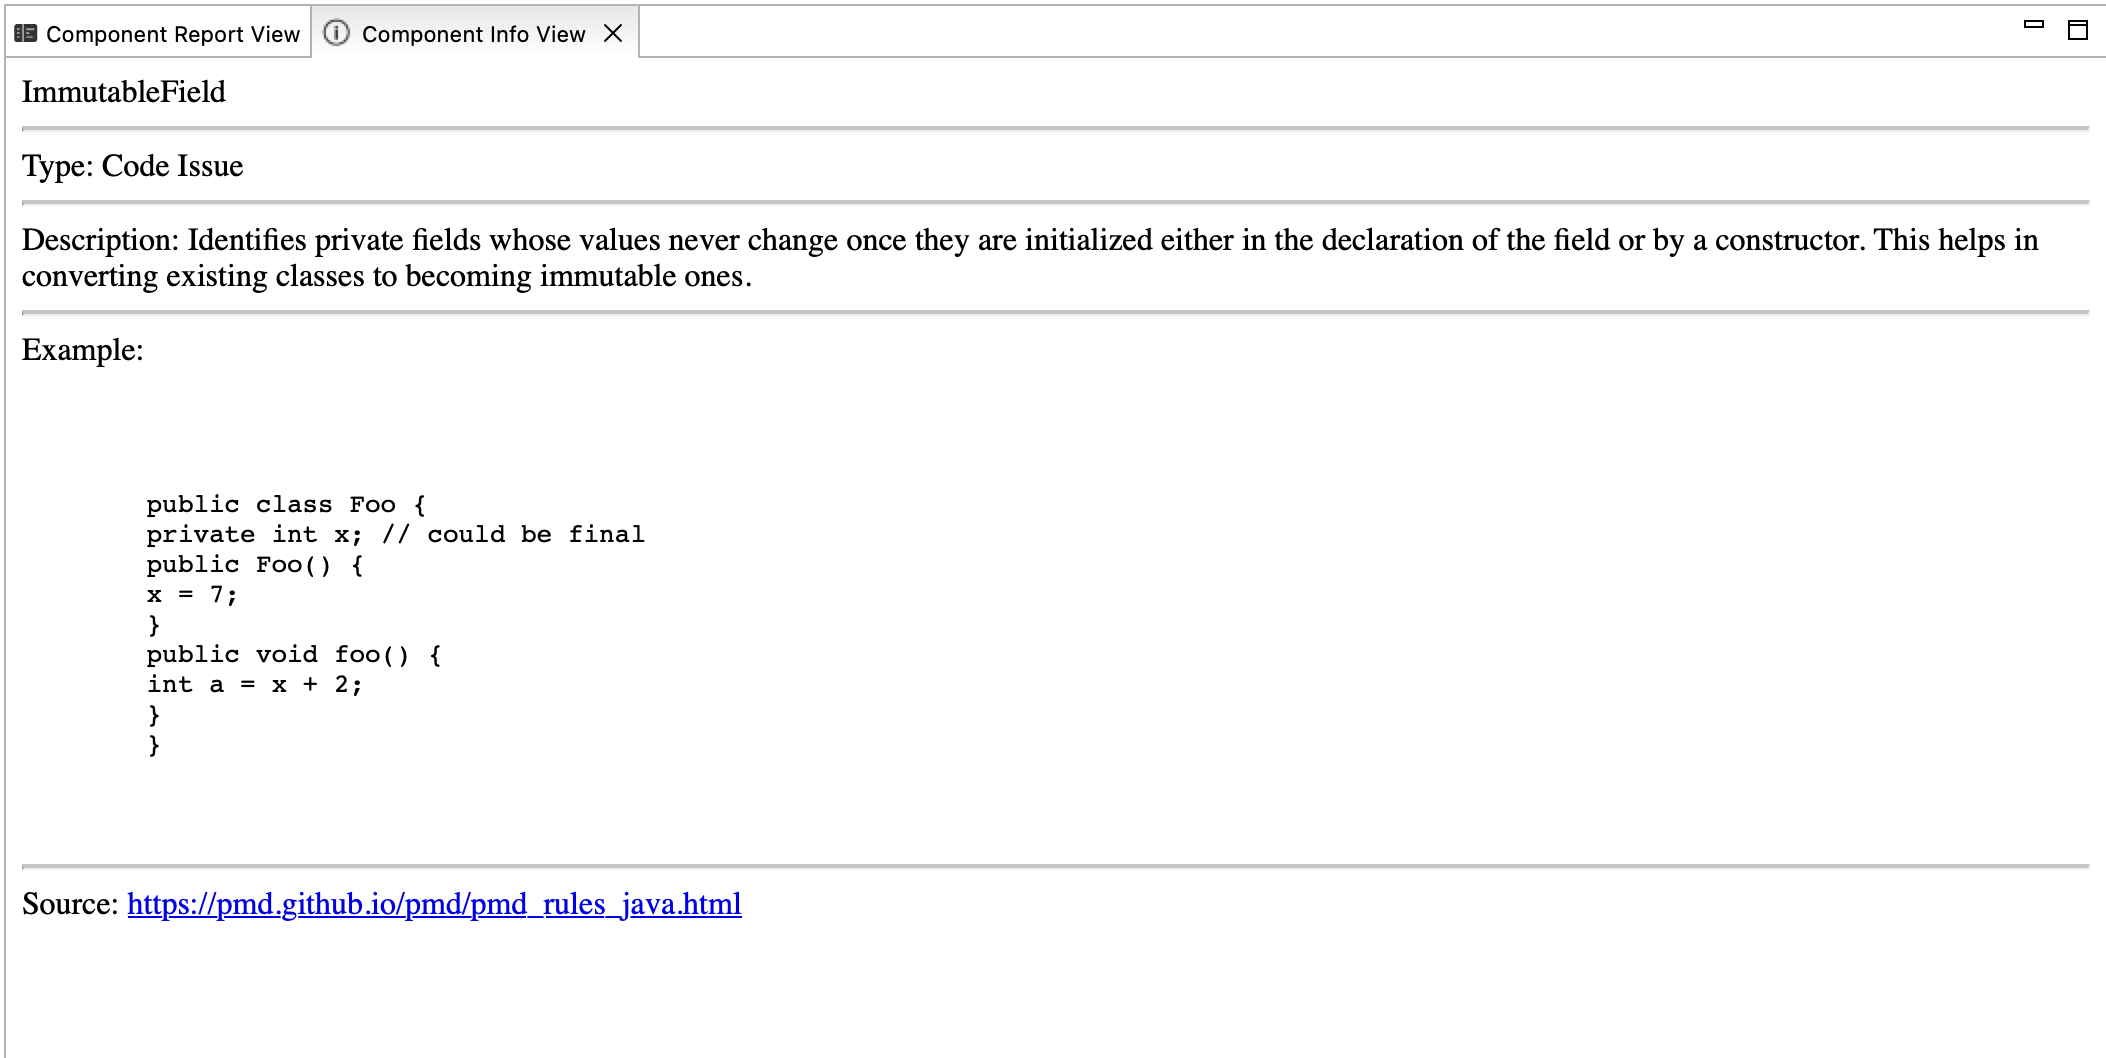
- Metric Details
Hovering on ruler icon on vertical bar in editor gives the metric details of respective component
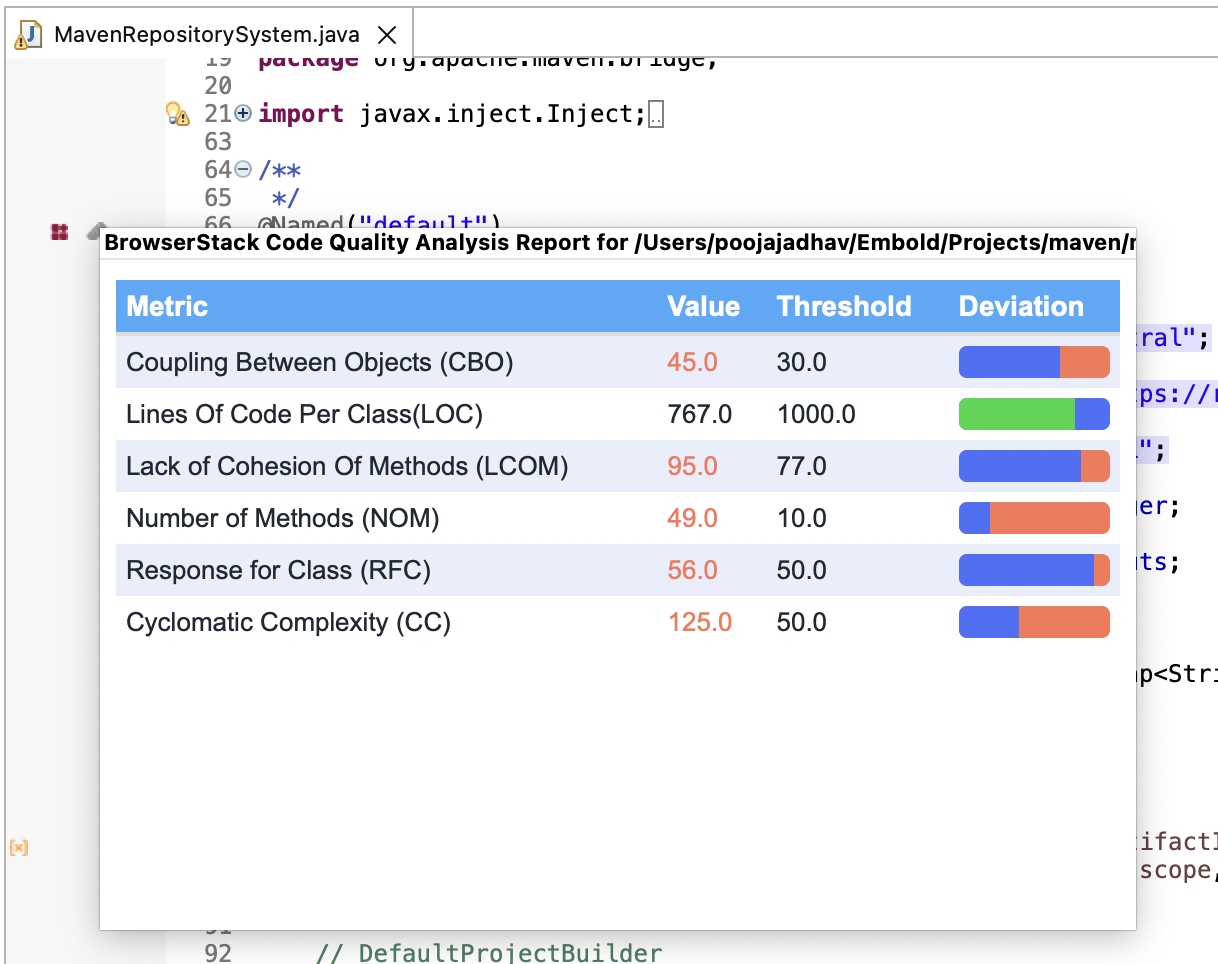
IntelliJ Plugin
In the Embold IntelliJ plugin, the detected code issues are highlighted on the fly and you can have quick-fix solutions as you edit the code. This plugin helps to enable or disable your code issues from Embold Global Settings by filtering the code rules according to the criticality. Moreover, anti-patterns can aid in providing error-prone solutions.
Code issues and anti-patterns’ count with its criticality can be visualized graphically. It can analyse the code written in the Java language.
For more information, refer to this link.
Prerequisites
- Java version: 1.8+
- Supported Intellij version:
- IntelliJ IDEA Community : 2019.3+
- IntelliJ IDEA Educational: 2019.3+
- IntelliJ IDEA Ultimate: 2019.3+
- IntelliJ IDEA 2021.2 (Community Edition)
- Android Studio version: 4.0+
- Android Studio build: 193.2252+
Installation steps
Install the Embold plugin from the IntelliJ IDEA marketplace.

Embold plugin is now available at the marketplace.
Scanning options
Embold supports 2 scanning options to scan the files in IntelliJ. They are as below:
- Scan single file
- Scan all files with Embold.
Scan a single file
Embold will automatically scan the file when a change is triggered in the file.
Scan all files with Embold
- Right click on editor.
- Select option “Scan all files with Embold”.

- Scanning all files with Embold may take a considerable amount of time to complete the analysis. Accept the pop-up to proceed. Click “Proceed” button.
- Embold will scan all files and publish the analysis result on “Embold Issues Inspector” and “Fly (Yellow Ballon)“ option.
Analysis of output
In the Embold IntelliJ plugin, the code issues are highlighted on the fly, and quick feedback is provided.
This ensures that the code issues are fixed even before the code is committed.
The code issues with its recommended solution can be seen under the “Embold Issues Inspector” section.

For example in the above screenshot, the code is analyzed at runtime, with the below output:
- On the left side, you see the type of issue with its description, criticality, and other details. Whereas, when you click on a specific issue, detailed information with examples can be seen on the right side.
Code issues and anti-patterns’ count can be visualized graphically.
The below output is seen in the graphical representation:
1. Issues by criticality– The issue count is calculated according to its criticality such as critical, high, medium, low, and info level issues.
2. Issues by type: Code issue and anti-pattern count are calculated.

- Clickable graphical representation is enhanced with in-depth granularity. Each section is segregated according to criticality and issue type (i.e. code issues and anti-patterns) displayed in a new tab known as the “Issues” tab.

- In the Embold IntelliJ plugin, the lines are highlighted on which code issues are present, and quick feedback is provided.
- On the fly, the “Disable Embold rule” option is available.
- This ensures that the code issues are fixed even before the code is committed.

In the above screenshot, the code issues are present on line number 2 (i.e. highlighted), and on the fly “Disable Embold rule ” option is available.
AutoDoc
Overview
- Embold AutoDoc generator is an AI-based comment generator tool that currently supports Java only for the IntelliJ plugin.
- The support for more languages is coming soon.
- Embold generates Java docs that help to produce a set of documentation comments for a method. This implementation delivers you faster and accurate results.
License Agreement for Embold service
The user needs to accept the terms of service by clicking on the “Accept” button.
- This will allow user to utilize Embold features by making an agreement.
- Once, license agreement is made, a pop-up window is displayed to the user. This AutoDoc premium feature is available for free use for a limited period.
How to generate the Embold AutoDoc?
- You need to install the latest Embold IntelliJ plugin from the marketplace.
AutoDoc can be generated using 3 ways:
A. Follow the below steps:
- Right-click on the method name
- Click on ‘generate…’ (Alt+Insert)
- Click on ‘Embold AutoDocs’
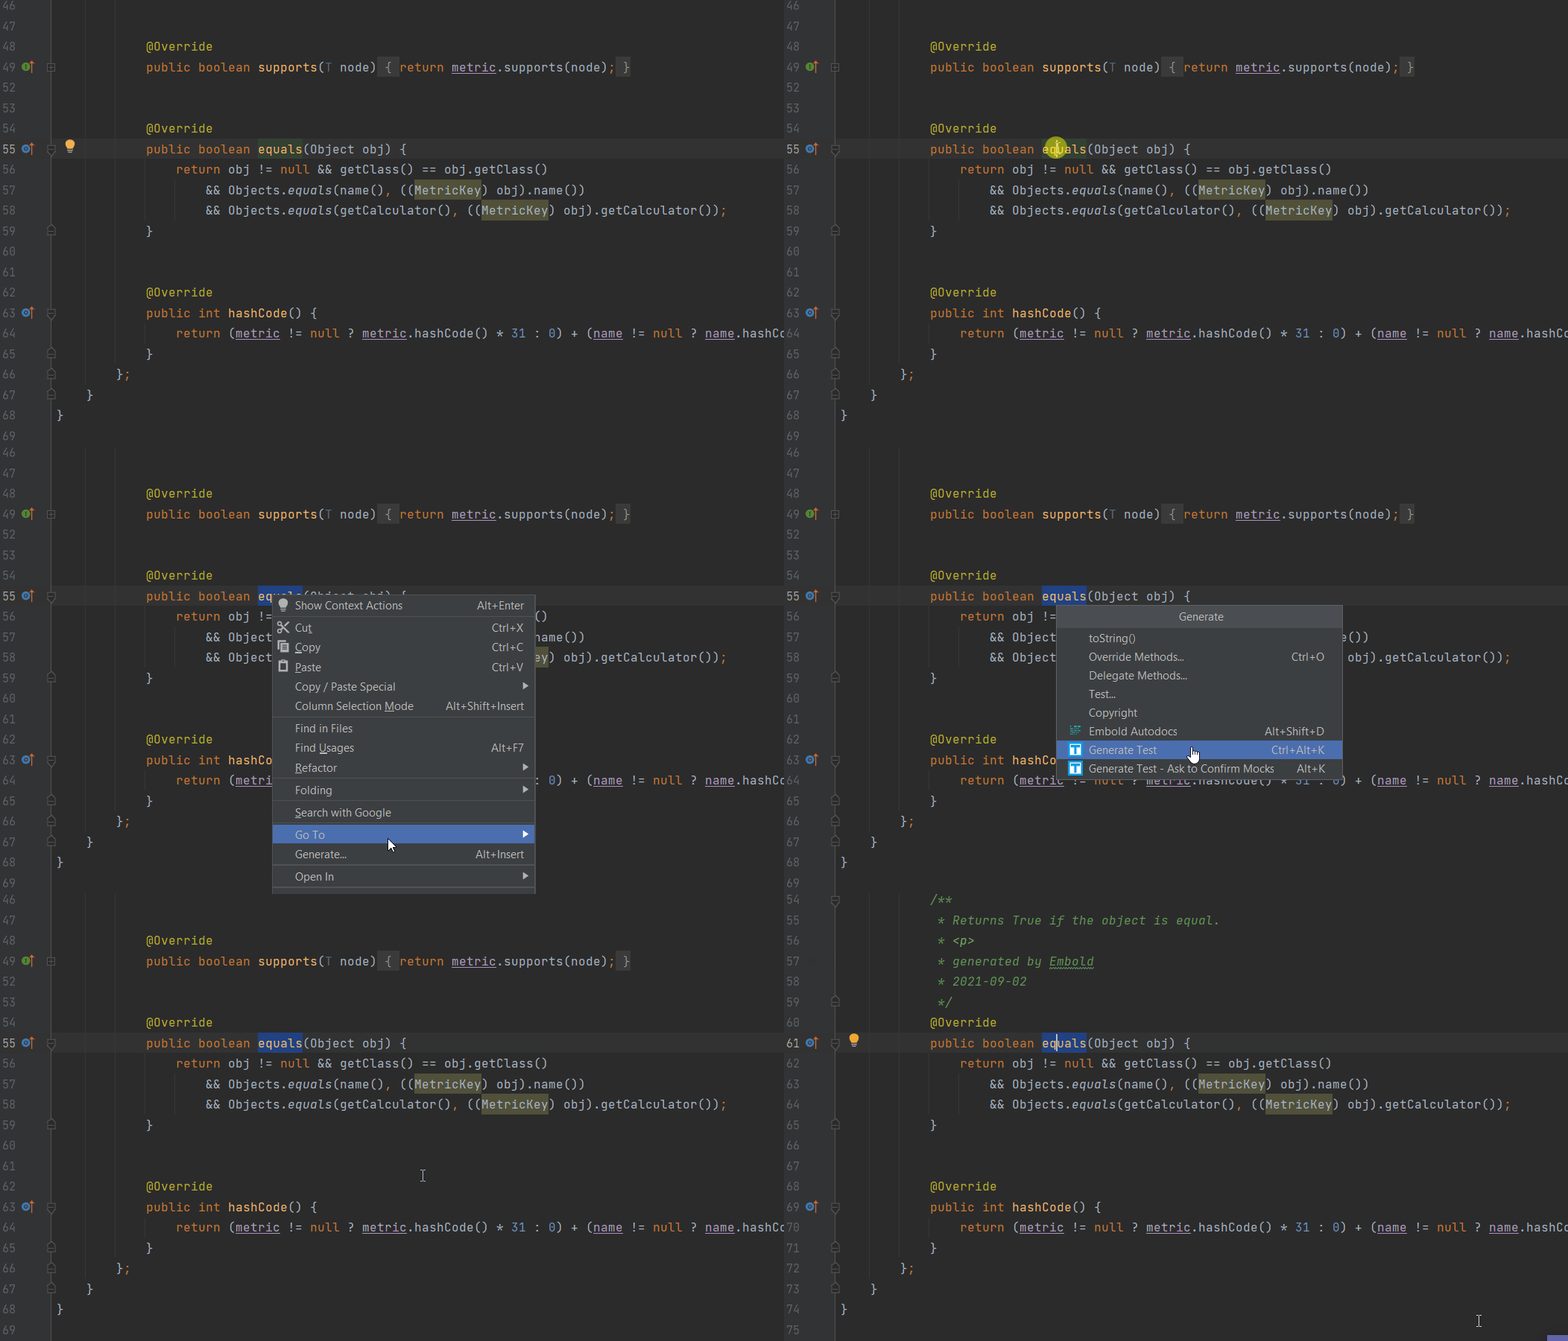
4. All set now! Embold will generate Java docs for you.
- Note: Embold will replace old Java docs with the new ones if already present.
B. You can also select the method name and use the shortcut key as ‘Alt + Shift + D’ to generate Java docs using Embold.
C. When user hovers on method name, a bulb icon is displayed. User can select “Generate comments using Embold AutoDoc”.

The comments get generated as shown in the below output:

Code checker configuration
This section helps to understand the supported code checks for Java language. Embold code checks can be enabled and disabled according to user requirement.
Critical Level Issues
| Rule | Description | Example | KPI | Tags |
|---|---|---|---|---|
| Compile Regex Once | Pattern object compiles the regular expressions which are passed to them and this compilation happens in the memory. If a regular expression is used many times, then this compilation should be performed only once. | Non-compliant code:Class Foo {Compliant code: Class Foo { | Efficiency | |
| Disabled Spring Securitys CSRF | CSRF protection is enabled by default in the Java configuration. Disabling CSRF protection can create a major security threat. Cross-Site Request Forgery (CSRF) is an attack that forces an end user to execute unwanted actions on a web application in which they're currently authenticated. More Info - OWASP Top 10 A6:2017 - Security Misconfiguration CWE-352 - Cross-Site Request Forgery (CSRF) | Non-compliant code:@ConfigurationCompliant code: @Configuration | Security | |
| Resource Leak | Resource should be closed in finally block. Another way is to use try-with-resource. In case of either exception or no exception, close() should always be put in finally clause. | Non-compliant code:class Demo {Compliant code: class Demo { | Resource Utilization | |
| Weak Cipher Algorithm | Use strong cryptographic algorithms as they are less vulnerable to brute force attacks among others. For more information : : OWASP Top 10 2017 Category A3 - Sensitive Data Exposure MITRE, CWE-327 - Use of a Broken or Risky Cryptographic Algorithm | Non-compliant code: class CipherExample Compliant code: | Security | |
| Possible Thread Leak In Executor Service | Thread leak can be possible if ExecutorService is not getting shutdown.There is a queue of tasks between client threads and thread pool. When the normal thread finishes the "run" method (Runnable or Callable), it will be passed to garbage collector for collection. But with ExecuterService, threads will be simply put on hold and they will not be selected for garbage collection. Therefore, the shutdown is needed for ExecutorService. | Non-compliant code: class Demo {Compliant code: class Demo { | Resource Utilization | |
| Non Private Field In Synchronized Block | Non-private, non-final field accessed in synchronized block indicates possibly partial synchronization, and does not protect direct access to the field from other parts of the system without synchronization. Make the field private and/or final, and provide accessors which can enforce synchronization. More Info - CWE-820 - Missing synchronization | Non-compliant code:class NonPrivateFieldAccessInSynchronizedBlock {Compliant code class NonPrivateFieldAccessInSynchronizedBlock { | Robustness, Security | |
| Database Should Be Password Protected | Database connection should always be password protected. Attacker can access the sensitive data from the database, in case it is not secured by password. More Info - [OWASP Top 10 2017 Category A3] - Sensitive Data Exposure - [MITRE, CWE-521] - Weak Password Requirements | Non-compliant code:class CipherExample {Compliant code class CipherExample { | Security | |
| Should Not Use getRequestedSessionId API | This method returns the session ID specified by the client and may not be the same as the ID of the current valid session for this request. If the client does not mention a session ID, it returns null. The session ID returned is either transmitted in a cookie or a URL parameter, hence by definition nothing prevents the end-user from manually updating the value of this session ID in the HTTP request. More Info - [CWE-807] - Reliance on Untrusted Inputs in a Security Decision - [OWASP] - Broken Authentication | | Security | |
| Web Application Contains Main Method | This method returns the session ID specified by the client and may not be the same as the ID of the current valid session for this request. If the client does not mention a session ID, it returns null. The session ID returned is either transmitted in a cookie or a URL parameter, hence by definition nothing prevents the end-user from manually updating the value of this session ID in the HTTP request. More Info - [CWE-489] - Leftover Debug Code - [OWASP] - Sensitive Data Exposure | ``` | Security | |
| Authenticate LDAP Connection | Anonymous binds and unauthenticated binds allow access to information in the LDAP directory without providing a password. Therefore using these binds is strongly discouraged. More Info - [OWASP Top 10 2017 Category A2]- Broken Authentication - [CWE-521] - Weak Password Requirements - [ldapwiki.com] - Simple Authentication | | Security | |
| Potential Command Injection | Avoid using unfiltered input to process executor APIs because that can lead to arbitrary command execution. More Info - [OWASP] - Command Injection - [OWASP: Top 10 2013 A1] -Injection - [CWE-78] - Improper Neutralization of Special Elements used in an OS Command ('OS Command Injection') | | Security | |
| Potential Path Traversal | Path traversal is a web security vulnerability that allows an attacker to read arbitrary files on the server that is running an application. This might include application code and data, credentials for back-end systems, and sensitive operating system files. More Info - [CWE-22] - Improper Limitation of a Pathname to a Restricted Directory ('Path Traversal') - [OWASP] - Path Traversal | | Security | |
| Accessing Android external storage is security-sensitive | Files or data stored in the android application should be security-sensitive. Files can be globally readable or writable as they are stored on external storage. Avoid storing sensitive information on the external storage as anyone can tamper with the data or remove the files by using any application. **More Info** - [OWASP Top 10 2017 Category A1](https://owasp.org/www-project-top-ten/2017/A1_2017-Injection.html) - Injection - [OWASP Top 10 2017 Category A3](https://owasp.org/www-project-top-ten/2017/A3_2017-Sensitive_Data_Exposure) - Sensitive Data Exposure - [CWE-312](https://cwe.mitre.org/data/definitions/312.html) - Cleartext Storage of Sensitive Information - [CWE-20](https://cwe.mitre.org/data/definitions/20.html) - Improper Input Validation accessing android external storage | | Security | |
| Using unsafe Jackson deserialization configuration is security-sensitive | JThe untrusted data could cause abuse to application logic. Jackson's deserialization should be configured securely. Implement @JsonTypeName and @JsonSubTypes to prevent serialized data from an untrusted source. It can help to safeguard the data from external attackers. **More Info** - [OWASP Top 10 2017 Category A8](https://owasp.org/www-project-top-ten/2017/A8_2017-Insecure_Deserialization) - Insecure Deserialization - [CWE-502](https://cwe.mitre.org/data/definitions/502.html) - Deserialization of Untrusted Data | | Security | |
| Setting JavaBean properties is security-sensitive | The JavaBean property uses a set or get functions that are exposed to other applications. An attacker can modify its properties, attack malicious code that can be risky. Avoid storing sensitive information under this JavaBean property as it may help the user to retain its software integrity. **More Info** - [OWASP Top 10 2017 Category A8](https://owasp.org/www-project-top-ten/2017/A8_2017-Insecure_Deserialization) - Insecure Deserialization - [CWE-502](https://cwe.mitre.org/data/definitions/502.html) - Deserialization of Untrusted Data | | Security | |
| Run Should Not Be Called Directly | The program accidentally calls the Thread.run() method and causes the code to be executed in the current thread, just like any other method call. Instead, use Thread.start() to actually create a new thread so that the runnable's 'run()' method is executed in parallel. More Info [CWE-572] - Call to Thread run() instead of start() | Non-compliant code class Demo {Compliant code class Demo { | Functionality, Efficiency | |
| Exclude SpringBootApplication And ComponentScan From The Default Package | Exclude "SpringBootApplication" and "@ComponentScan" from the default package. | Non-compliant code import org.springframework.boot.SpringApplication;Compliant code package javacodechecker; | Efficiency | spring |
High-Level Issues
| Rule | Description | Example | KPI |
|---|---|---|---|
| Initialization Of Secure Random At Method Level | "SecureRandom" should not be initialized in method. Every SecureRandom generation is seeded from some entropy pool. Creating a new SecureRandom method on every call might slow down the application as it might block the creation of seed. Use a statically created instance instead. | Non-compliant code class Demo { Compliant code class SecureRandomGenerator { | Security |
| Security Sensitive Regex | Regular expressions are security-sensitive. Evaluating regular expressions with input string can be an extremely CPU-intensive task. The regular expression naive algorithm builds a Nondeterministic Finite Automaton (NFA), the attacker might use the knowledge of states of finite state machine to look for applications that use regular expressions, containing an Evil Regex, and send a well-crafted input, that will hang the system. Alternatively, if a Regex itself is affected by a user input, the attacker can inject an Evil Regex, and make the system vulnerable. | Examples of Evil Patterns: Examples of Evil pattern : 1) (a+)+ 2) ([a-zA-Z]+)* 3) (a|aa)+ 4) (a|a?)+ 5) (.*a){2} for x > 10 E.g Pattern: /(a+)+b/; Input string:aaaaaaaaaaaaaaaaaaaaaaaaaaaaaaaaaaab Instead use Pattern:(/a+b/) //fixed the hard-coded regex pattern to avoid possible captures, possessive quantifiers and back-references To avoid possible attacks, if the regex pattern is defined with an user-controlled input, it should be sanitized in order to escape characters which are part of the regular expression syntax. Non-compliant code class Demo { public boolean validate1(javax.servlet.http.HttpServletRequest request) { String regex = " /(a+)+b/"; String input = "aaaaaaaaaaaaaaaaaaaaaaaaaaaaaaaaaaab"; input.matches(regex); //Noncompliant Compliant code class Demo { public boolean | Efficiency, Security |
| Use Of System.err.println | 1. System.err.println is an IO-operation and therefore is time consuming. 2. The better approach is to use a logging framework for a message queue. 3. Moreover, you can configure separate log files for different purposes. | Non-compliant code class Demo {Compliant code class Demo { | Analyzability |
| Invalid Logging Class Name | Avoid incorrect class names while creating logger. Ignoring this may create confusion while analysing logs. | Non-compliant code public class LoggingClass extends BaseChecker {Compliant code public class LoggingClass extends BaseChecker { | Analyzability |
| Use Of System.out.println | 1.Sending messages to stdout is usually inappropriate in a production environment. E.g. If you are coding a GUI app, the information should be presented to the user and not to the stdout method anywhere. 2.System.out.println is an IO-operation and therefore is time consuming. The better approach is to use a logging framework for a message queue. 3.Moreover, you can configure separate log files for different purposes. | Non-compliant code class Demo { Compliant code public void process2() { | Analyzability |
| Complex Regex Pattern | Avoid usage of complex Regex pattern as it involves heavy processing.In some cases complex Regex performance test shows that regex is significantly inefficient. | //Non-compliant code class Demo { | Efficiency |
| Empty Catch Block | Empty Catch Block finds instances where an exception is caught, but nothing is done. In most circumstances, this ignores an exception which should either be acted on or reported. Avoid keeping the catch block empty. | // Non-compliant code class Demo {// compliant code public void process2() { | Analyzability |
| Empty Catch Block | Empty Catch Block finds instances where an exception is caught, but nothing is done. In most circumstances, this ignores an exception which should either be acted on or reported. Avoid keeping the catch block empty. | // Non-compliant code class Demo {// compliant code public void process2() { | Analyzability |
| Sensitive Info Logged | Logger is used for recording application activity. Information displayed on the logs is visible to different stakeholders. Avoid logging sensitive information such as password, key, social security number etc. Not complying may compromise the system security. | Non-compliant code:class Demo {Compliant code class Demo { | Security |
| Main Should Not Throw Anything | The main method should not throw any checked exception, instead, it needs to handle properly. If a non-checked exception is thrown (and not catch) in the main method, it will terminate. | Non-compliant code: Compliant code public static void main(String[] args) { | Functionality |
| Avoid Synchronized At Method Level | Avoid synchronized at method level. When new code is added to the existing method then method-level synchronization can cause problems so to avoid these kind of problems use block-level synchronization. Block-level synchronization helps to ensure that only the code that needs synchronization gets it. | Non-compliant code:Compliant code public class SynchronizedCounter { | Efficiency |
| Shortcircuit Logic Should Be Used In Boolean Contexts | Using non-short-curcuit logic is a mistake it can also cause serious problem error. | Non-compliant code:Compliant code | Efficiency |
Medium Level Issues
| Rule | Description | Example | KPI |
|---|---|---|---|
| Return Empty Array Or Collection Instead Of Null | Returning null value instead of an empty array or collection can lead to denial-of-service vulnerabilities when the client code fails to explicitly handle the null return value. For methods that return a set of values using an array or collection, returning an empty array or collection is an excellent alternative to returning a null value. More Info MET55-J - Return an empty array or collection instead of a null value for methods that return an array or collection MSC19-C - For functions that return an array, prefer returning an empty array over a null value | Non-compliant code: class Demo {Compliant code: class Demo { | Robustness |
| Preserve Stack Trace In Logs | Preserve stack trace in logs. This will help to analyse the logs in case of any exception. | Non-compliant code:class Demo {Compliant code: class Demo { | Analyzability |
| Read Only Transaction | Spring components support database transactions using "@Transactional" annotation. If readOnly attribute is not explicitly set to true, we will have read/write transactions for select queries. Hence, it is always recommended to explicitly specify the readOnly attribute. | Non-Compliant Code:class Demo {Compliant Code: class Demo { | Robustness |
| Unusual REST Practice | The best practices while creating REST API's are : 1. URL should contain resources (E.g. nouns) only; not actions or verbs. 2. Singular and plural noun should not be mixed together. 3. Use plural noun only for all the resources. 4. Use GET method, instead of the POST method to fetch the data. 5. Use PUT, POST and DELETE methods to alter the state. | Non-compliant code class Demo {Compliant code class Demo { | Maintainability |
| Variables Should Not Be Self Assigned | Self-assignment of the variables can be confusing and leads to bugs; however, one should not assign a variable to itself. Hence, this statement can be redundant and removed. | Non-compliant code class Demo {Compliant code class Demo { | Functionality |
| Externalizable Must Have No Arguments Constructor | Externalizable interface cannot be deserialized without a non-argument constructor,so non-argument constructor must be implemented. | Non-compliant code public class Car implements Externalizable { Compliant code public class Car implements Externalizable { | Efficiency |
| Getters And Setters Should Access The Expected Fields | Getter and Setter methods must access the expected fields. For each instance variable, a getter method returns its value, while a setter method sets or updates its value. For example, 'active' is an instance variable and 'setActive' (boolean value) is a setter method. Instead of unexpectedly updating any field, it must update or set the active variable. | Non-compliant code class Demo {Compliant code private boolean active; | Functionality |
| RunFinalizersOnExit Should Not Be Called | Remove Runtime::runFinalizersOnExit and System::runFinalizersOnExit methods. It can be enabled with "System.runFinalizersOnExit" and "Runtime.runFinalizersOnExit".It may result in finalizers being called on live objects while other threads are concurrently manipulating those objects, resulting in unexpected behavior or deadlock. - [CWE-586]- Explicit Call to Finalize() | Non-compliant code public static void main(String [] args) {Compliant code public static void main(String [] args) { | Efficiency |
| Big Integer Instantiation | Use already existing BigIntegers (BigInteger.ZERO, BigInteger.ONE, BigInteger.TEN).Instead of creating a new object with new BigInteger better use one static object which is created once when the BigInteger class is loaded. It is likely to yield significantly better space and time performance. Zero and One is probably the most fundamental number in mathematics. Using static objects avoids the allocation about 48 bytes and the need to collect them back later in a tight loop that can matter. | Non-compliant code BigInteger bigInteger = new BigInteger("1"); Compliant code BigInteger bigInteger = BigInteger.ONE; | Efficiency |
| Maps With Enum Values Replace With EnumMap | If Map has all the key values from the same Enum then Map should be replaced with EnumMap because the underlying data structure is a simple array so it will be more efficient than other sets. | Non-compliant code public class MyClass {Compliant code public class MyClass { | Functionality |
| Mismatch Regex Boundaries Should Not Be Used | In the regular expression by switching $ and ^ boundaries it will never match and it can be misused. | Noncompliant Code pattern.compile("$[a-z]+^");Compliant Code pattern.compile("^[a-z]+$"); | Functionality |
| Avoid Concatenating Char As String | Avoid concatenating characters as strings because using string rather than char creates unnecessarily space accommodation in heap space. Appending a character as a char will always be faster than appending it as a String. | Noncompliant Code class Demo {Compliant Code class Demo { | Functionality |
| Empty String Should Not Be Used | Concatenating empty string with literals during conversion is inefficient. | Noncompliant Code String s = "" + 456;Compliant Code String t = Integer.toString(456); | Functionality |
| Exceptions Should Not Be Thrown In Finally Block | Exception that is thrown in finally block will mask any previous exception in try or catch block and the stack trace and exception message will be lost. | Noncompliant Code try {Compliant Code try { | Functionality |
Low-Level Issues
| Rule | Description | Example | KPI |
|---|---|---|---|
| Log Level Info In Catch Block | The catch block handles exception that occurs in associated try block. In this block, the logger level is expected to be as "error". This is a good list describing the log levels : 1. Debug : Used for development and testing. 2. Information : Used to output information that is useful to run and manage your system. 3. Warning : Used for handled 'exceptions' or other important log events. 4. Error : Used to log all unhandled exceptions. This is typically logged inside a catch block at the boundary of your application. 5. Fatal : Used for special exceptions/conditions where it is imperative that we can quickly pick out these events. | Non-compliant code: class Demo {Compliant code: class Demo { | Analyzability |
| Non Thread Safe Field Declaration | A field declared inside the spring component should be thread safe. By default, beans in spring are singleton. Multiple threads accessing the same component may produce inconsistent results, if they access fields declared globally. | Non-compliant code: class Demo {Compliant code: class Demo { | Robustness |
Info Level Issues
| Rule | Description | Example | KPI |
|---|---|---|---|
| String Concatenation In Logging | Instead of string concatenation use parameterized logging. Concatenation is calculated before the condition check. If you call your logging framework multiple times which turns to be false, this effort will be a waste of time. E.g. if you call your logging framework 10K times conditionally and all of them evaluates to be false, concatenation will happen 10K times. | Non-compliant code: class Demo {Compliant code: class Demo { | Efficiency |
| Tightly Coupled Class | A spring component such as repository, service and controller should auto-wire the interface, instead of its implementation class. Ignoring this, will increase tight coupling among the classes | Non-compliant code:class Demo {Compliant code: class Demo { | Maintainability |
VSCode Plugin
Embold VSCode extension uncovers potential code issues, vulnerabilities, metrics, and hard-to-detect anti-patterns that make your code difficult to maintain and can lead to error-prone solutions. The extension currently supports C/ C++, Java, JavaScript, and Typescript.
Prerequisites
- Supported Vscode version: 1.62.0+
- Cppcheck version : 2.4.1
- Eslint version: v7.32.0
- Tslint version: 5.9.1
- Jshint(Optional -Only if you are enabling in Embold server): version : 2.9.5
- Java version: 1.8 or higher
- Supported Languages: C/CPP, Java, JavaScript, Typescript, C#
- Supported OS: Linux, Windows and Mac OS
Note: For Mac OS following languages are not supported- JavaScript
- TypeScript
- C#
- C/CPP
Installation steps
Install the Embold plugin from the VSCode marketplace.
- Go to the ‘view’ menu.
- Select the ‘Extensions‘ sub-menu.
- SSearch ‘Embold’ in the search box.
- Click “Install” button on the left navigation pane.
- Extension successfully installed.
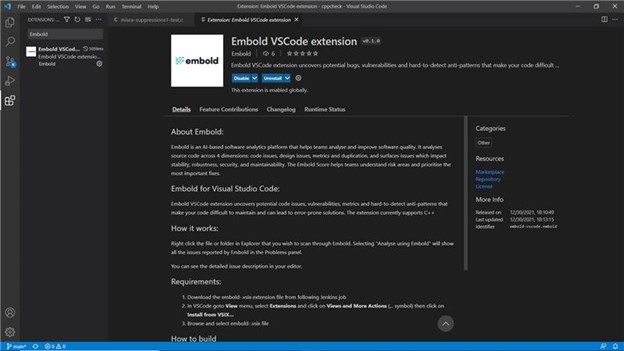
Install Embold Server Certificate
This is most likely because of the firewall setting on your network, which rejects HTTPS requests if the Embold server certificate is not installed in the Java trust store of your machine.
Please follow these steps to install the same:
- In Edge, go to
https://packages.embold.io, click on the certificate icon that appears in the address bar, click the “Connection is Secure” line item, which then looks like this:
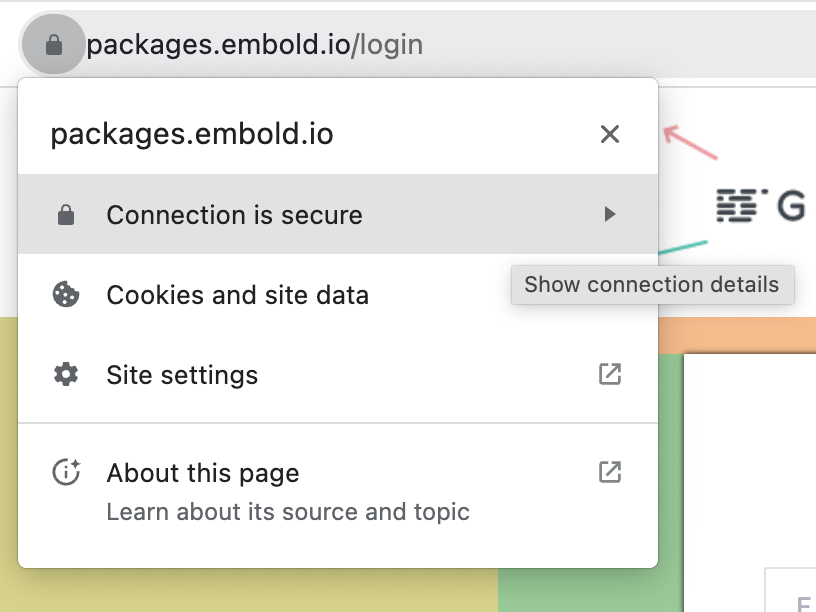
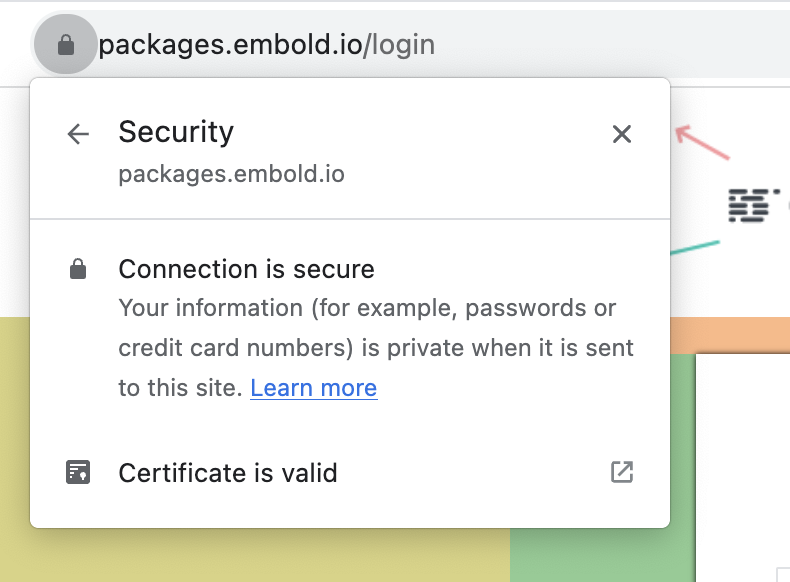
2. Click on the certificate is valid, go to Details Tab and click on Export button:
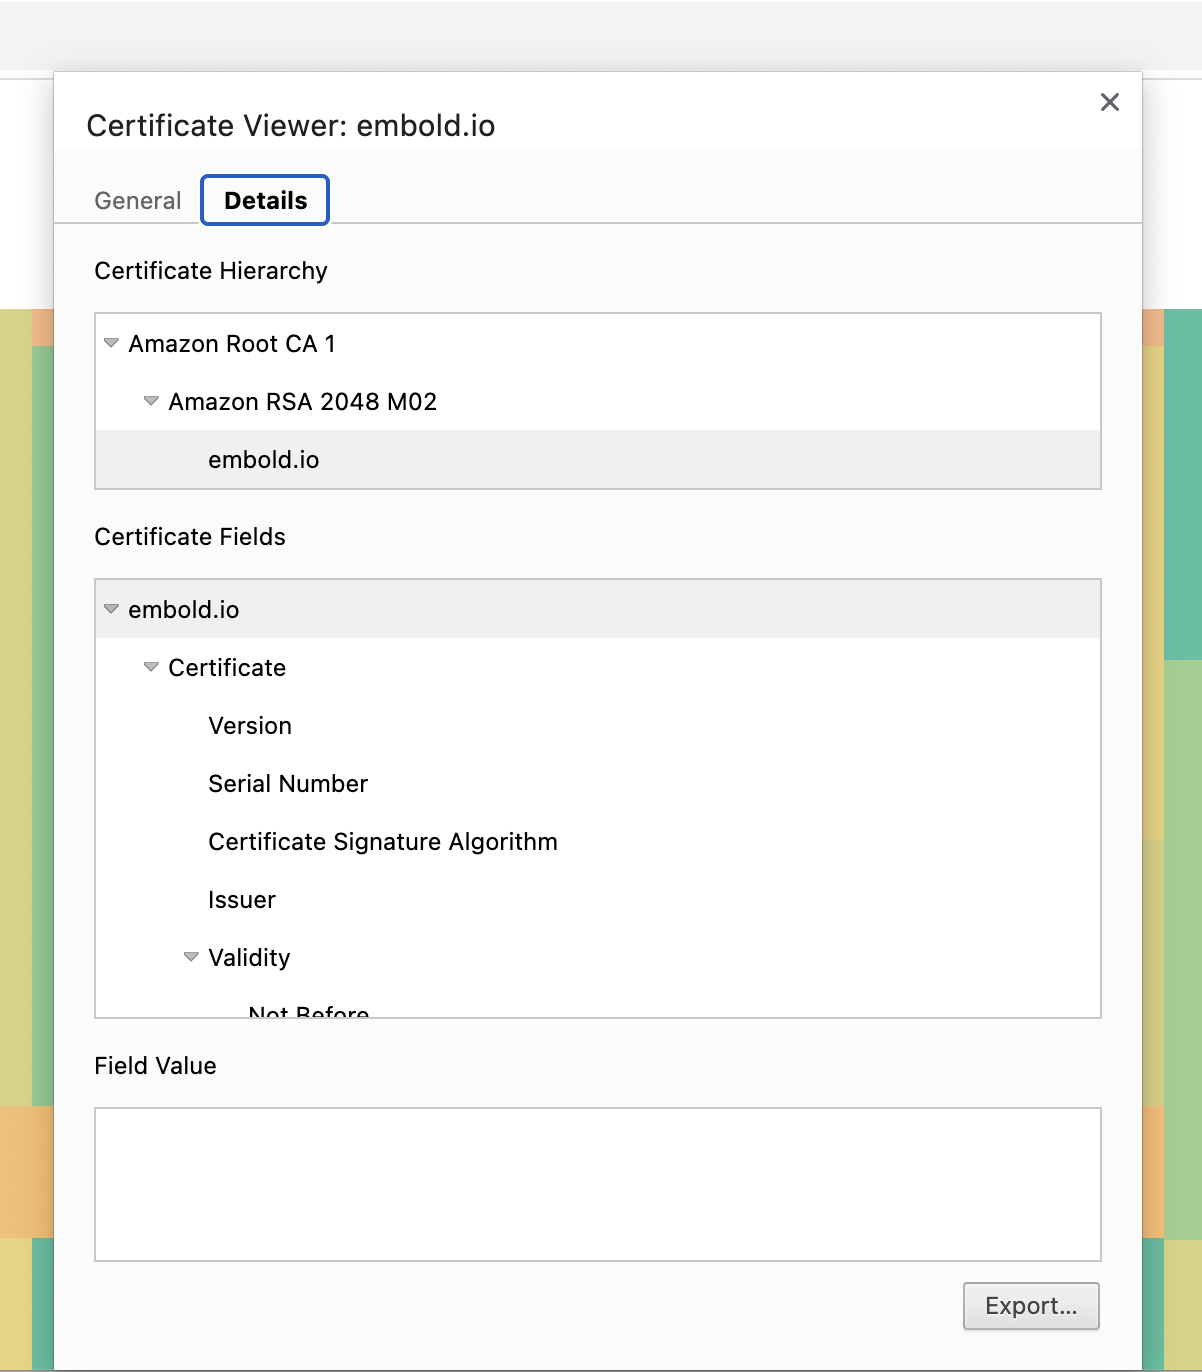
3. In the Export window, select file name as “embold.io” and Save as Type: DER-Encoded binary, single certificate:
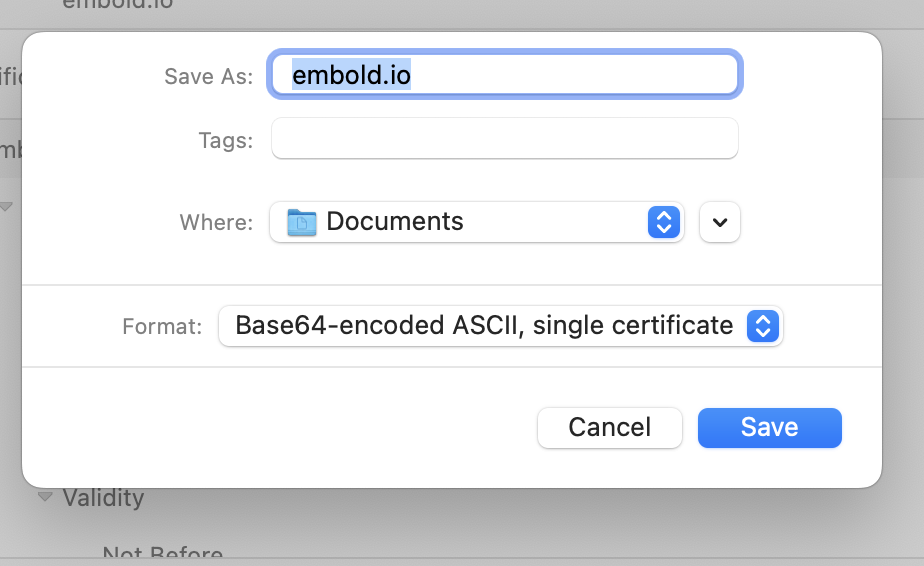
4. Once the file is saved, go to command line and run the following command:
- “c:\Program Files\Java\jre-1.8\bin\keytool.exe” -importcert -trustcacerts -alias embold.io -file c:\Users\embold\Downloads\embold.io.der -keystore “C:\Program Files\Java\jre-1.8\lib\security\cacerts”
- Please adjust the paths above as per your installation (e.g. JRE Path and the certificate file path where you saved it)
- It will prompt for keystore password, and the default keystore password for Java is “changeit”
- It will prompt you to verify the certificate, and type “yes” at the end.
- This will then install the certificate on your computer, which the firewall should then allow.
Install Cppcheck
You have to install cppcheck (Version 2..4.1) manually on your machine.
Installation on Windows
- Go to ‘
https://sourceforge.net/projects/cppcheck/files/cppcheck/2.4/cppcheck-2.4.1-x64-Setup.msi/download‘. - Open downloaded
.msifile. - Install Cppcheck.
- Check version on cmd:
cppcheck --version.
Installation on Linux
Execute commands on the terminal:
git clone --branch 2.4.x https://github.com/danmar/cppcheck.git /cppcheckmkdir /cppcheck/buildcd /cppcheck/buildcmake ..cmake --build . -- -j16make installcd /rm -rf /cppcheckcppcheck --version
Install Eslint
Execute command from cmd/terminal:
npm install -g eslint@v7.32.0 –save-dev
# or
yarn add eslint@v7.32.0 –dev
Install Tslint
Execute command from cmd/terminal:
npm install -g tslint@5.9.1 –save-dev
# or
yarn add tslint@5.9.1 –dev
Install Jshint
Note: Jshint (Optional – Only if you are enabling in Embold server)
Execute command from cmd/terminal –
npm install -g jshint@2.9.5 –save-dev
# or
yarn add jshint@2.9.5 –dev
Proxy Settings
We have added a proxy setting in the VSCode extension.
Add the following environment variables if you are using any custom proxy settings.
1.EMB_PROXY_HOST
E.g. 192.168.1.127
2.EMB_PROXY_PORT
E.g. 3128
3.EMB_PROXY_USERNAME (Optional)
4.EMB_PROXY_PASSWORD (Optional)
How does it work?
Right-click on any .c/.cpp/.h/.hpp file or folder containing .c/.cpp/.h/.hpp any of these files. Select ‘Analyze Using Embold‘.’.
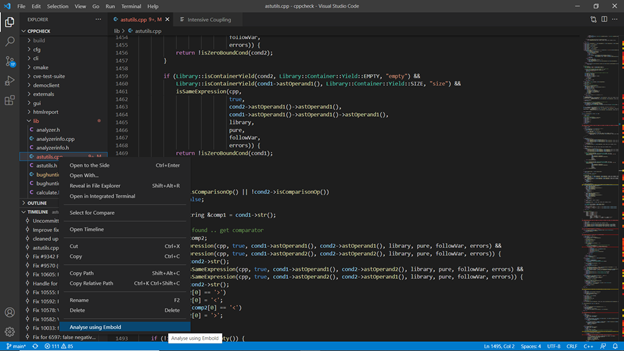
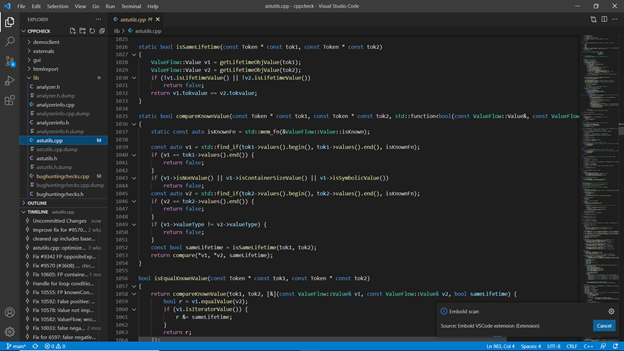
Analysis of output
After scan completion, analysis results will be displayed on the “PROBLEMS” view.
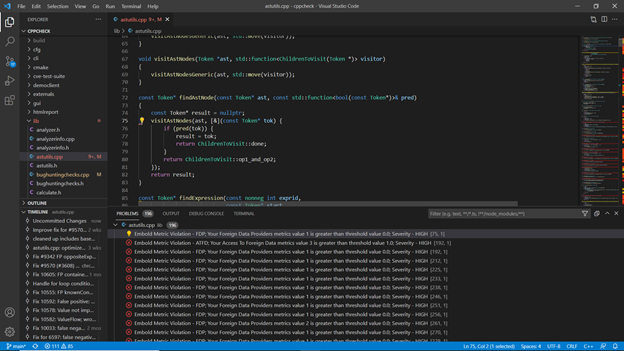
Show Description option is available on a quick fix. For metric violation – a quick fix will redirect to the documentation page.
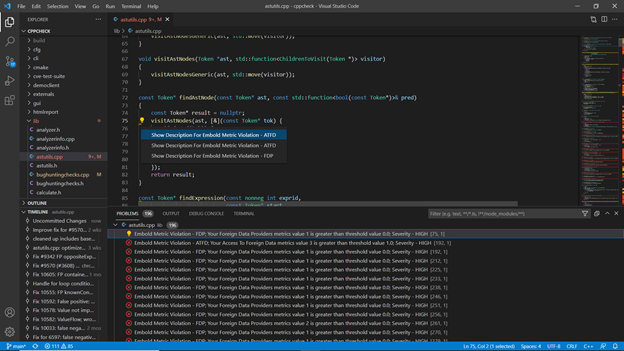
For Design Issue – It will show a new tab for insights with an animated progress bar.
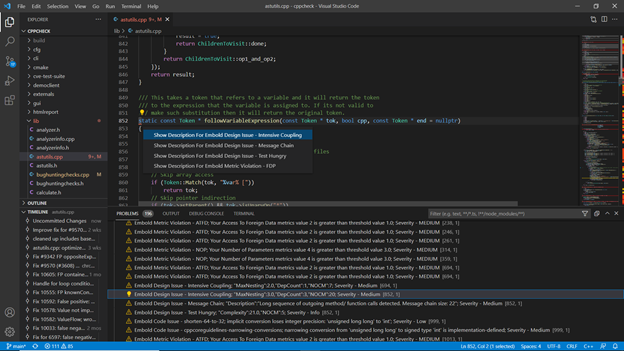
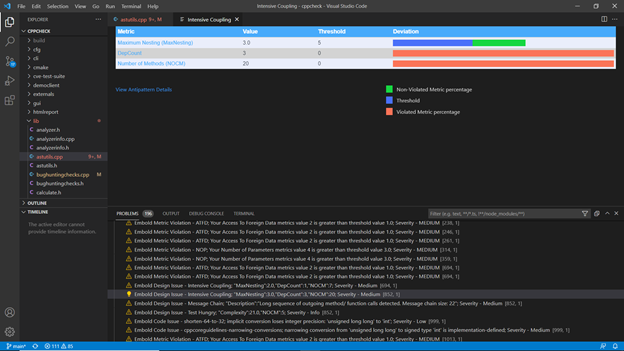
For Code Issue – It will redirect to the Rules page documentation.
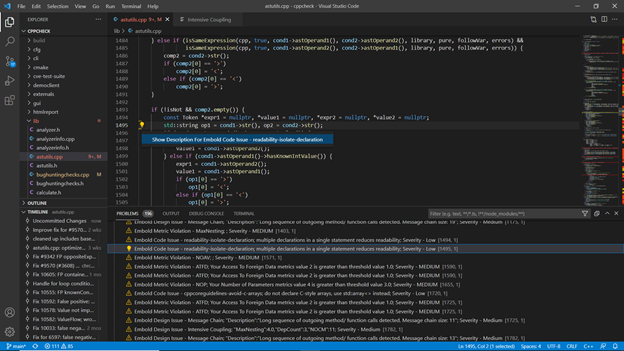
Recommendation Engine
Overview:
- In this section, we will see how to setup Recommendation Engine and Embold on same Linux host.
- We will also see how an existing embold server can be integrated with RE .
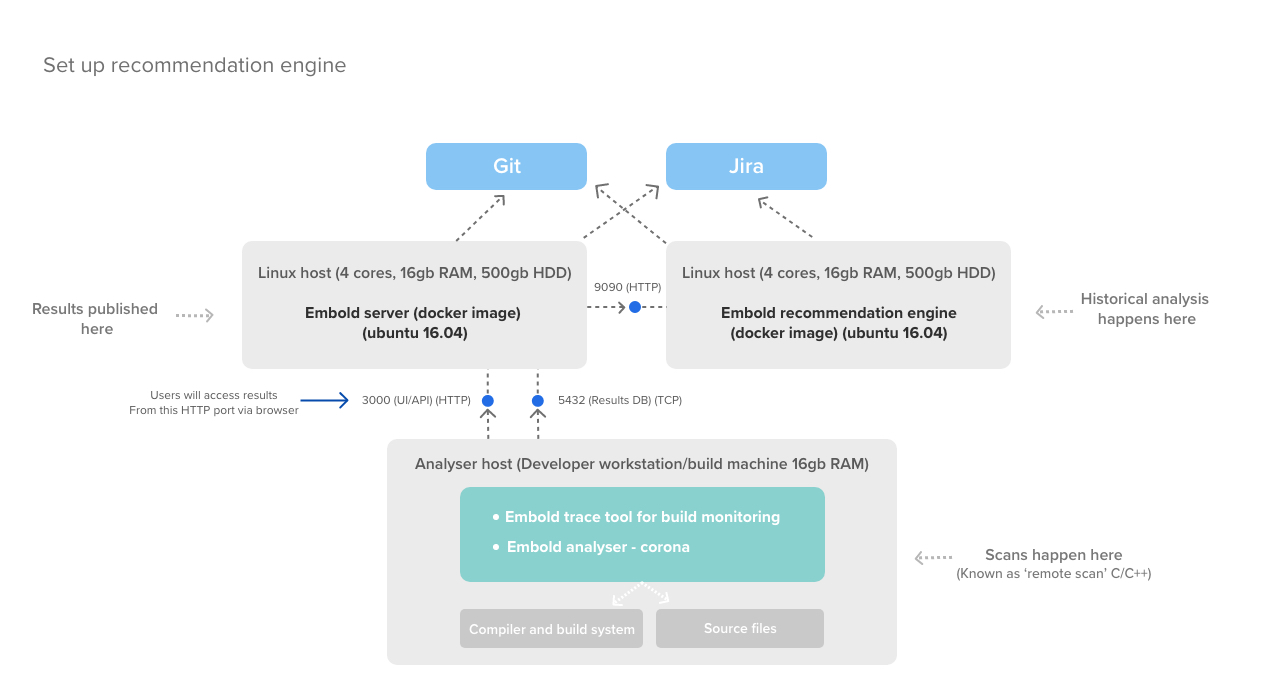
Installation steps
- Prerequisites:
- docker engine
- docker-compose, version 1.25.0 or up
- In order to install Embold RE with docker-compose, you need 3 images:
- bitnami/mongodb:4.2.21 (Available on docker hub as public image)
- bitnami/elasticsearch:7.17.5 (Available on docker hub as public image)
- embold/gammare-snapshot:<current ver> (Available on Embold private docker repo,or as a tar.gz file in your Embold account)
- If the host where you will install RE has internet access, you need to download and load only embold/gammare-snapshot: prior to running docker-compose
- Image procurement and setup process
- Download Embold RE image (tar.gz) from your Embold account (Releases section : https://codequality.browserstack.com/self-managed/v1/portal/)
Or, You can run below command to downloadwgethttps://v1.embold.io/nfs/re/0.9.4/embold_re_0.9.4.tar.gz - On the docker host machine that will run RE, run:
docker load -i embold_re_0.9.4-SNAPSHOT.tar.gz- If you need to download the mongodb and elasticsearch images as well, run the steps below: On some machine with internet access:
docker pull bitnami/mongodb:4.2.21docker save -o mongodb.tar.gz bitnami/mongodb:4.2.21docker pull bitnami/elasticsearch:7.17.5docker save -o elasticsearch.tar.gz bitnami/elasticsearch:7.17.5- On the docker host machine that will run RE, run:
docker load -i mongodb.tar.gzdocker load -i elasticsearch.tar.gz- Prepare the docker-compose script, directories and environment variables
- Create an environment file (e.g. re_env) in a folder with these 2 variables in it:
# Edit to your actual host paths!!GAMMA_RE_DATA=/home/${USER}/BrowserStackCodeQuality/gamma_re_dataGAMMA_RE_LOGS=/home/${USER}/BrowserStackCodeQuality/log/path/gamma_re_logs- IMPORTANT!!
Create the directories/home/and${USER}/BrowserStackCodeQuality/gamma_re_data/mongo_data/data /home/on the host${USER}/BrowserStackCodeQuality/gamma_re_data/elastic_data- Change recursive ownership of to the user/group 1001:1001 like below:
chown -R 1001:1001 /home/${USER}/BrowserStackCodeQuality/gamma_re_data chown -R 1001:1001 /home/${USER}/BrowserStackCodeQuality/gamma_re_logs
- Download Embold RE image (tar.gz) from your Embold account (Releases section : https://codequality.browserstack.com/self-managed/v1/portal/)
- Creation of docker-compose yaml
- Now with all components in place, you can run docker-compose with this sample script i.e docker-compose.yaml file:
version: '2'

  indexer:
    image: bitnami/elasticsearch:7.17.5
    volumes:
      - ${GAMMA_RE_DATA}/elastic_data:/bitnami/elasticsearch/data

  gammare:
    image: embold/gammare:0.9.4
    container_name: gammare
    environment:
      - ES_DB_URL=mongodb://db_mongo:27017/
      - ES_INDEXER_URL=http://indexer:9200
    ports:
      - "9090:9090"
    volumes:
      - ${GAMMA_RE_DATA}:/opt/gammare_data
      - ${GAMMA_RE_LOGS}:/opt/gammare_logs

  db_mongo:
    image: bitnami/mongodb:4.2.21
    volumes:
      - ${GAMMA_RE_DATA}/mongo_data:/bitnami/mongodb
    ports:
      - "27017:27017"
    healthcheck:
      test: ["CMD", "mongo", "--eval", "db.runCommand({ connectionStatus: 1 })"]
      interval: 30s
      retries: 5
      timeout: 10s
- Save above file as “docker-compose.yaml” in the same directory where you have created re_env file
- Start the embold services with the following command from directory where re_env file is created:
docker-compose --env-file=./re_env up -d- If all goes well, the last few messages in $GAMMA_RE_LOGS/cmodsrv.log (
GAMMA_RE_LOGS=/home//cmodsrv.log) should look like:${USER}/BrowserStackCodeQuality/gamma_re_logscmoddb.py:27 INFO| Initialized CmodDbcmoddb.py:27 INFO| Initialized CmodDbcmoddb.py:266 INFO| Cleared 0 requests from build queue
To Activate BrowserStack Code Quality goto activation.
Integrate existing standalone embold docker with RE
NOTE : Before you jump to this section , complete all the above steps except execution of docker-compose file.
Assume below is the docker command you have used to run standalone embold docker.
docker run -m 10GB -d -p 3000:3000 --name EMBOLD -e gamma_ui_public_host=http://<IP/domain name>:<Port> -e RISK_XMX=-Xmx1024m -e ACCEPT_EULA=Y -e ANALYSER_XMX=-Xmx6072m -v /home/${USER}/BrowserStackCodeQuality/gamma_data:/opt/gamma_data -v /home/${USER}/BrowserStackCodeQuality/gamma_psql_data:/var/lib/postgresql -v /home/${USER}/BrowserStackCodeQuality/logs:/opt/gamma/logs embold/gamma:$EMBOLD_VERSION
So In above docker-compose.yaml, you have to edit only gamma section,
In environment, add -e RISK_XMX=-Xmx1024m -e ACCEPT_EULA=Y -e ANALYSER_XMX=-Xmx6072m from the standalone docker command
In volumes, replace values and use -v /home/${USER}/embold/gamma_data:/opt/gamma_data -v /home/${USER}/BrowserStackCodeQuality/gamma_psql_data:/var/lib/postgresql -v /home/${USER}/BrowserStackCodeQuality/logs:/opt/gamma/logs from the standalone docker command
So finally your docker-compose.yaml will be as below
version: '2'

  indexer:
    image: bitnami/elasticsearch:7.17.5
    volumes:
      - ${GAMMA_RE_DATA}/elastic_data:/bitnami/elasticsearch/data

  gammare:
    image: embold/gammare:0.9.4
    container_name: gammare
    environment:
      - ES_DB_URL=mongodb://db_mongo:27017/
      - ES_INDEXER_URL=http://indexer:9200
    ports:
      - "9090:9090"
    volumes:
      - ${GAMMA_RE_DATA}:/opt/gammare_data
      - ${GAMMA_RE_LOGS}:/opt/gammare_logs

  db_mongo:
    image: bitnami/mongodb:4.2.21
    volumes:
      - ${GAMMA_RE_DATA}/mongo_data:/bitnami/mongodb
    ports:
      - "27017:27017"
    healthcheck:
      test: ["CMD", "mongo", "--eval", "db.runCommand({ connectionStatus: 1 })"]
      interval: 30s
      retries: 5
      timeout: 10s
Save above file as “docker-compose.yaml” in the same directory where you have created re_env file
- Start the embold services with the following command from directory where re_env file is created:
docker-compose --env-file=./re_env up -d
If all goes well, the last few messages in $GAMMA_RE_LOGS/cmodsrv.log (GAMMA_RE_LOGS=/home/${USER}/BrowserStackCodeQuality/log/path/gamma_re_logs/cmodsrv.log) should look like:
cmoddb.py:27 INFO| Initialized CmodDb
cmoddb.py:27 INFO| Initialized CmodDb
cmoddb.py:266 INFO| Cleared 0 requests from build queue
For configuration of a repository with a Recommendation Engine for the beta version, check the link here.
