Your first Embold scan
You can Sign Up on the new version of Embold using your existing Github or Bitbucket account. It will link your Embold account to the Git provider account making it easier to add repositories.
Creating an organization
Organizations are what Embold uses to store and manage your code; they contain the repositories you link to Embold. You can create as many organizations as you need and can add as many repositories to them as you like. For today’s tutorial, we’ll be creating a single organization and linking a single repository.
In short, organizations are nothing but creating projects in the Emboold.
Steps to add an organization:
- Add Personal Organization: Adding this personal organization (like Github) will import all your personal repositories from Github.
- Log into your Github account and add an organization to get started.
- Choose a single organization and click on the “Add organization” button. Once you have entered the information, click Add Organization.
- All the personal repositories will be imported and the user will navigate to the repository dashboard where you will get a glimpse of your project.

Choose the right pricing plan.
You just created your first organization on Embold!
Linking a repository
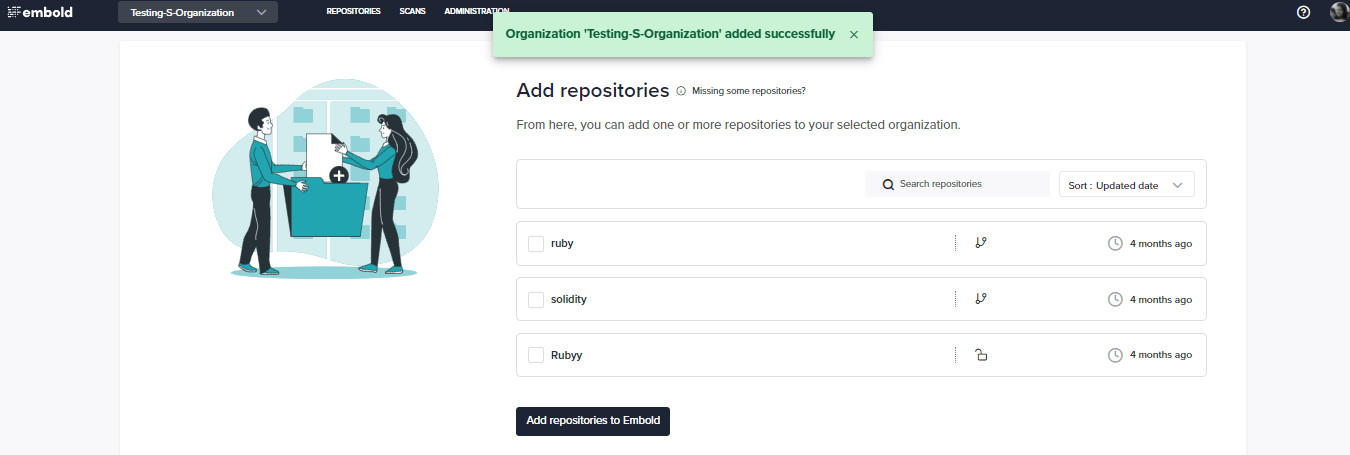
Repositories are the storage containers for your source code. Most of today’s repositories are stored using services like Github, GitLab, Bitbucket, etc. (view a full list of supported services here). In order to analyze any code on Embold, a repository must first be linked.
Steps to link a repository:
The repository gets automatically linked when an organization is connected with Embold.
Moreover, you can click on “Link more repositories” to add more repositories to Embold.
Select single/multiple repositories and click the “Add repositories to Embold” button.
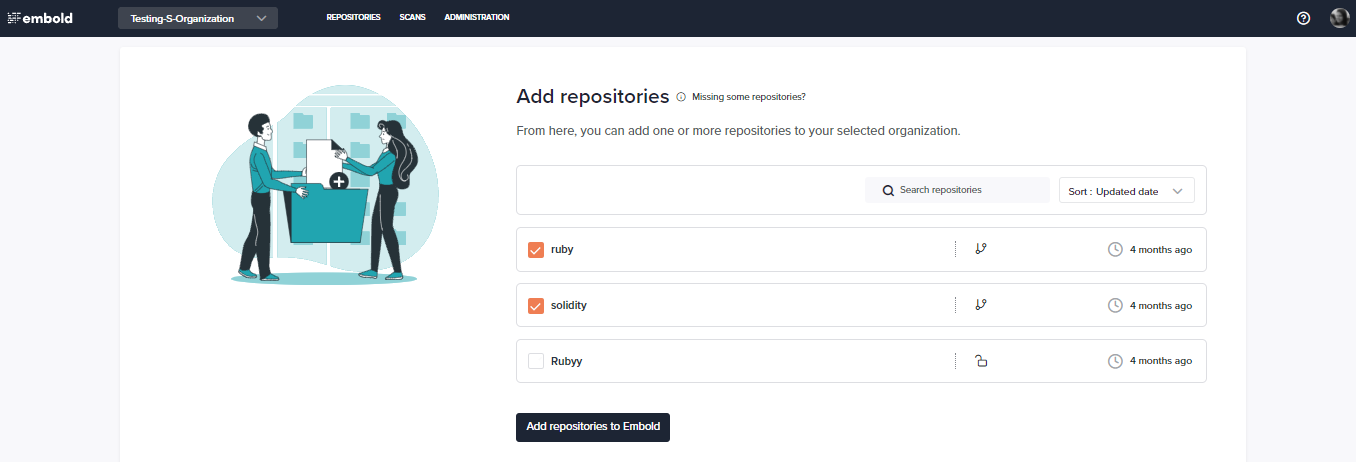
You just linked your repositories with Embold!
Scanning a repository
Scans are the foundation of Embold: Once started, Embold will analyze the given source code, generate metrics, identify code-issues and find software design anti-patterns. So let’s run a scan on the repository we just set up.
Run a scan
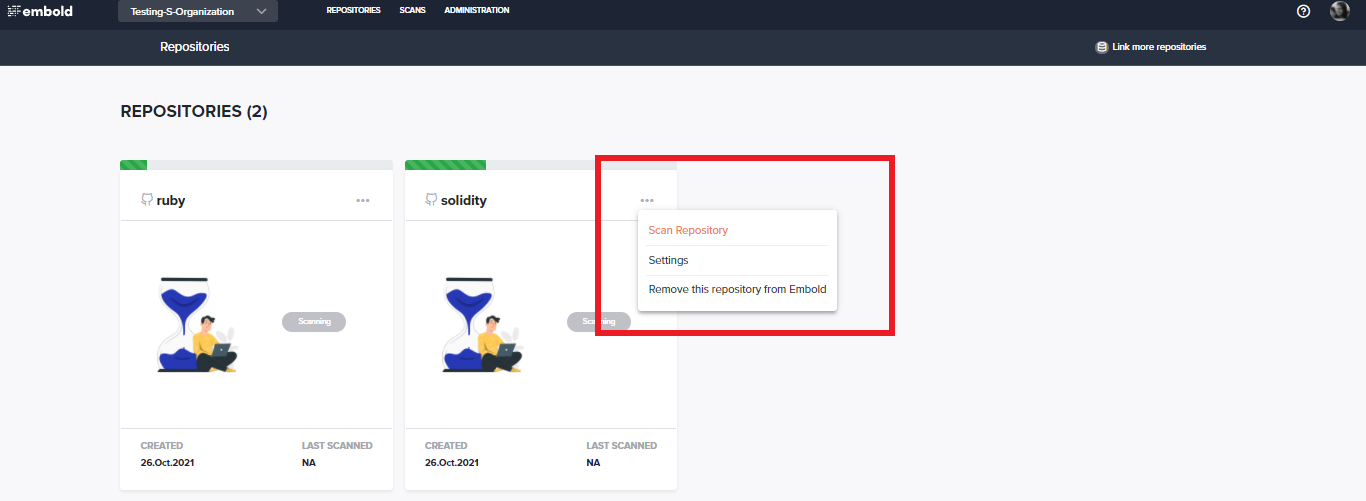
There are 2 ways through which scan can happen:
- Scanning starts automatically when a repository is added to the organization by clicking “Link more repositories“
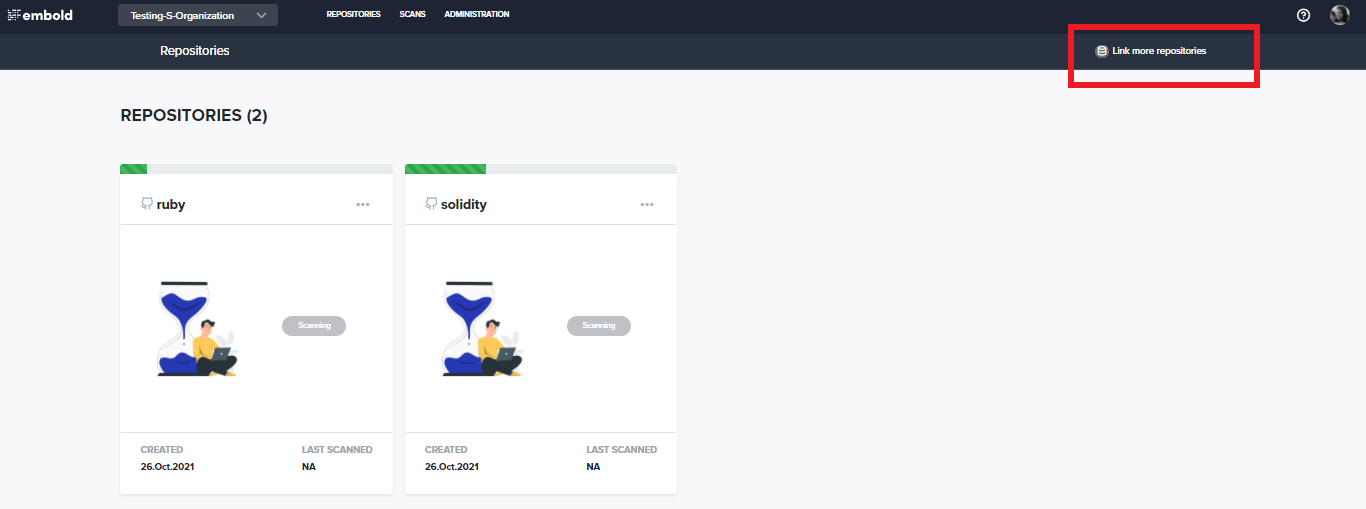
- Click on the three dots on the right corner and click the “Scan repository” option.
View scan progress
After clicking the Scans tab in the header section, you will see the scan status. You can track the scan status, along with all other currently running scans from the “Scan Queue” tab.
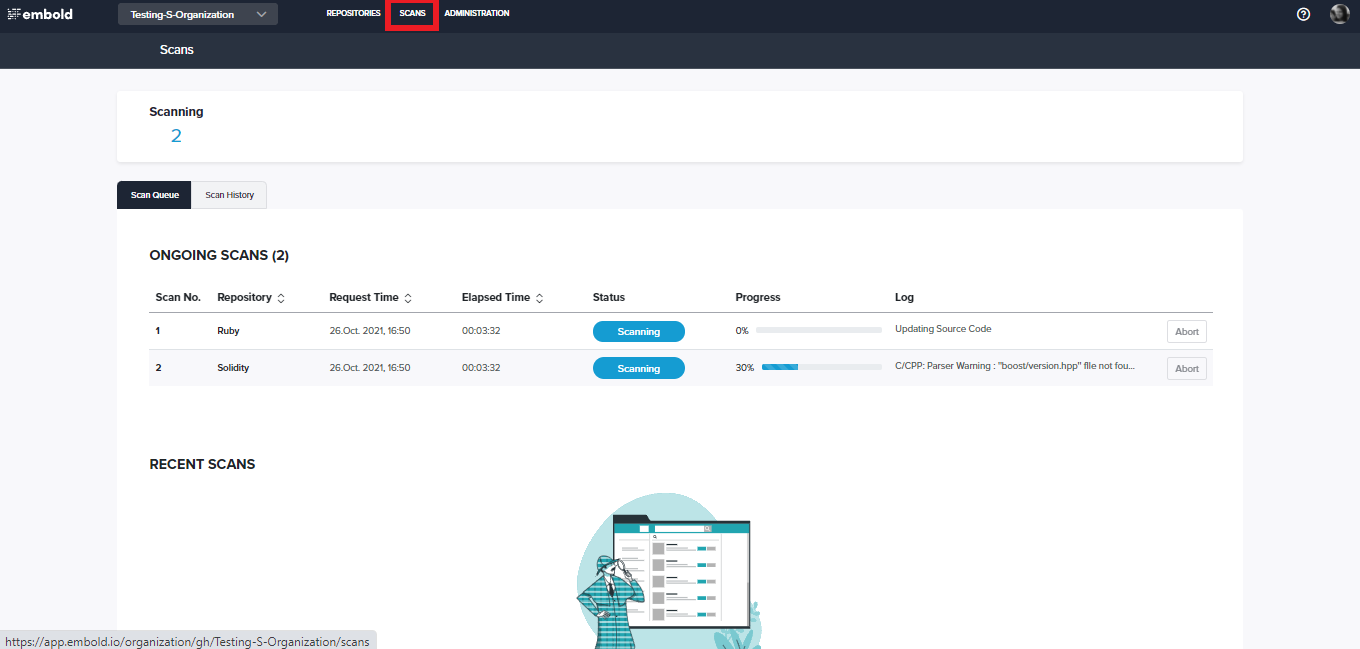
By clicking on an item on this list, the detailed progress monitor opens and can be used to monitor the scan progress.
After some time, the scan status should reach Completed.
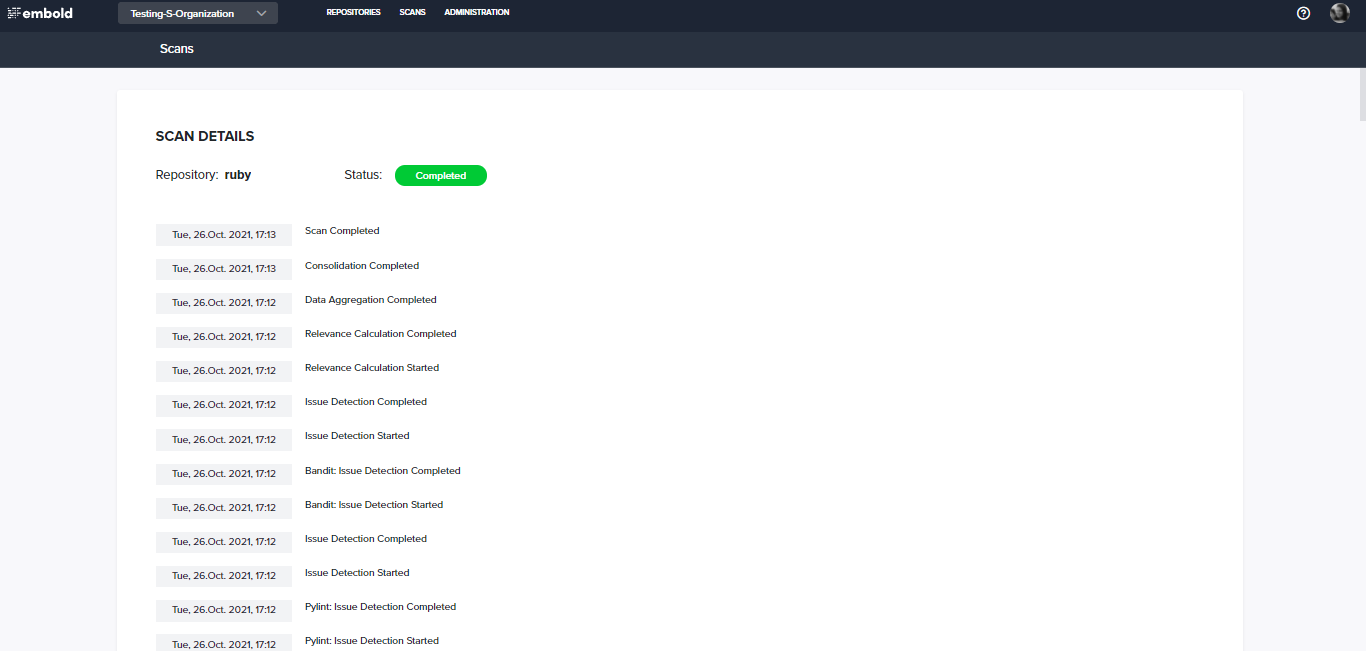
Congratulations! You just finished your first scan! You can now navigate back to the repository to have a look at the findings.
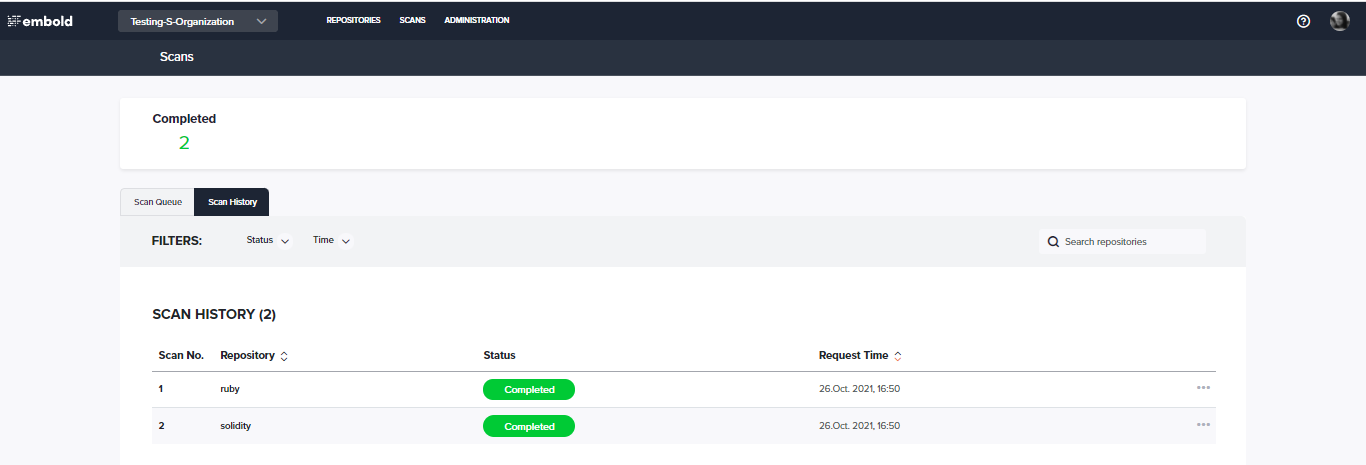
To check all previous scans, click on the “Scan History” tab.
Identifying Problems
Get an overview of your software and identify the most important issues.
Overview of your software
1. You need an active Embold account. (Don’t have one? Sign up free here).
2. Identifying Problems builds off of the lessons learned in the previous articles. To get the most out of this article we recommend you finish your first scan.
Embold rating system
The Embold rating system is a numeric representation of the quality of the software. The rating is calculated on every level; for a function, a method, a component, a package, and the overall software health. It ranges from -5 to 5, where -5 indicates a very bad rating and therefore bad quality, and 5 indicates that the software is exceptionally designed.
Rating enables you to quickly compare the quality between your organizations and repositories once you have more than one scanned.
The rating for certain aspects of the code, such as the anti-patterns, code issues, metrics, and duplication contributes to the overall Embold rating.
Reading the Repository Overview
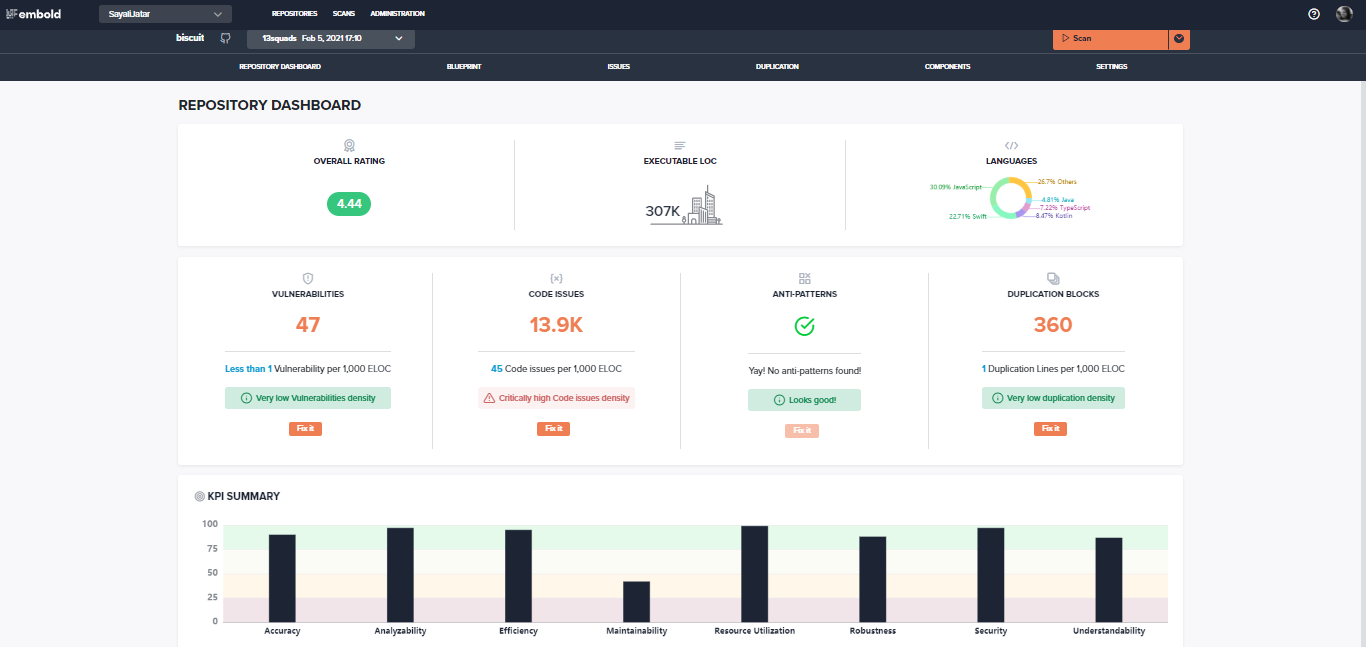
The Repository Overview shows the general state of your software at a glance. The first area to focus on is the ratings displayed in the tiles.
The top section of the overview page shows general information about the repository, such as the overall rating, the total lines of code (LOC), different languages supported.
Click on any tile to get more detailed information on each component like vulnerabilities, code issues, anti-patterns, and duplication.
View and interpret blueprint
What Does the Blueprint Show?
The blueprint can be accessed from the top navigation bar by clicking the Blueprint tab:
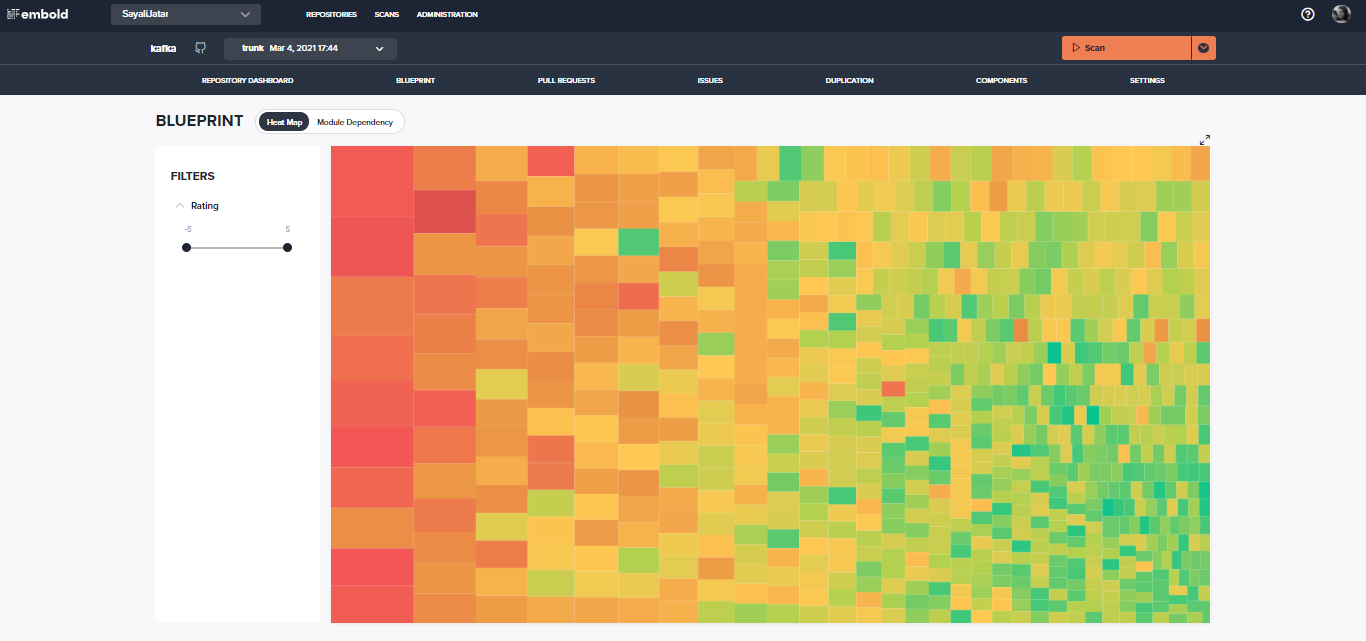
When you click it, you’ll be taken to the Blueprint page, which displays the major components of your repository. Each component is represented as a rectangle, where the size of the rectangle stands for the size (lines of code) of this component, and the colour represents the rating. The name of the component, as well as its rating on the rating scale, can be seen by hovering your mouse over the rectangles.
Use of Blueprint
The blueprint can be used for two things:
1. Understanding the overall quality of your software.
2. Identifying components to investigate further
The slider at the left side of the blueprint can be used to highlight the specific components that fall under the different ratings.
Identify top priorities with the component list
What does the component list show?
The component list can be accessed from the top navigation bar by clicking the Components tab:
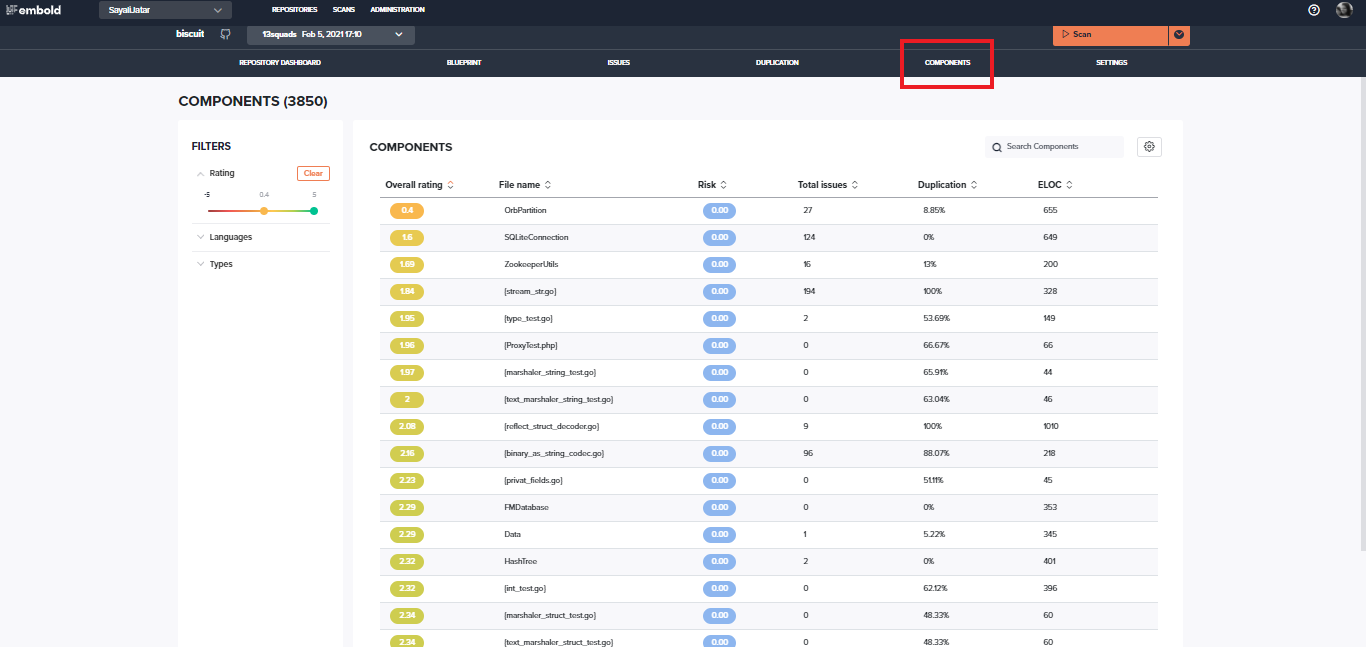
The overall score with a list of all components of your software can be seen in ascending order. The components with the worst score are at the top.
Similarly, the risk score is displayed according to the high to low-risk score.
How to assess the risk?
The Embold Risk rating is displayed in the first column, next to the component name. While the Overall Rating represents the software quality of one component, the Risk rating is about how much impact this component would have on your software should something go wrong. It is acceptable for a component to have a low Overall Rating in some projects if the risk associated with it is low. However, if a component has a high-risk rating but a low Overall Score, it should be addressed as soon as possible.
To find out how Embold helps to improve components, have a look at your Improving Hotspots.
More advanced features
The settings icon on the right side of the Component List can be used for more advanced features. You can filter the displayed rows by their different rating options, or by various component types.
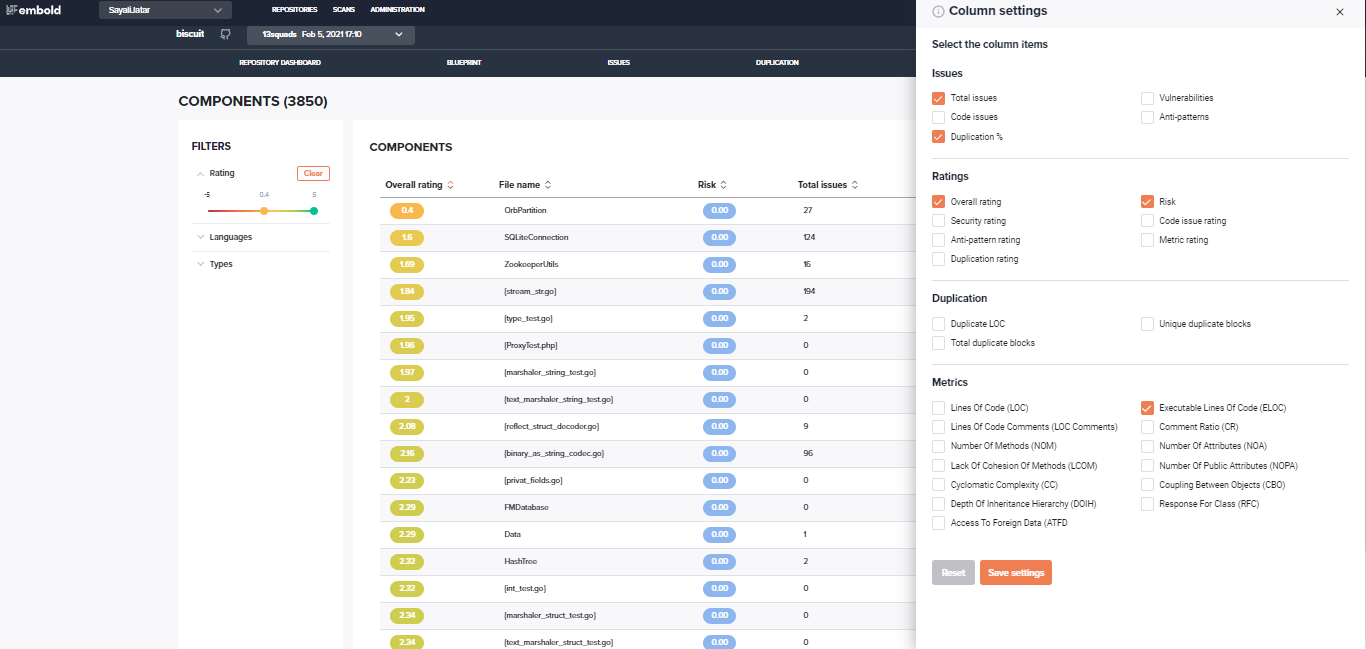
The Component List can also be used to display more information than just the ratings: it can display all calculated metrics and the duplication details as well. This can be selected from the Columns pop-over slider on the right side. You can view more information to learn about metrics here.
Dive through Issue Distributions
The previous sections showed how to identify potential low-quality components that need more attention, either through the Heatmap or the Component List. In this section, the focus is on two different aspects:
1. Identifying problematic packages
2. Identifying problem classes that lead to bad quality
What are the available Distribution Screens?

The distribution screens can be accessed from the top navigation bar:
Embold currently shows five different types of distributions:
- Design issue distribution
- Code issue distribution
- Metrics distribution
- Duplication distribution
- Hotspot distribution
Please click on “51 Code Issues” to access the code issue distribution now.
What does the Code Distribution screen show?
The distribution screen always shows the number of issues affecting the current package level that was selected from the Tree Navigation. Use the navigator on the top right and follow this path: src → main → java → org → apache → commons → text, then select “text” (unsure how to do this? Please look at this section to learn how to use the Tree Navigation). Your screen should look like this:

We can clearly witness 12 highly prioritized code issues have been found in the Str.Subsitutor.java file. The parameter menu on the right side of the screen can be used to change to a different view; use it and select “Modules vs Issue Types”.
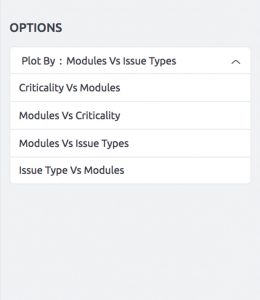
This graph shows how often certain types of code issues have been found. For Commons-Text, the issues identified most often have been “ConstructorCallsOverridableMethod” and “AvoidBranchingStatementAsLastInLoop”. These issues are always specific to the programming language used, so these issues are specific to Java. To find out more about these issues, click on the graph. For general information on each of these issue types please visit our code issues documentation.

Improving hotspot
BrowserStack Code Quality helps to analyze your data. There are a few ways through which hotspot can be improved:
Component explorer for fixing issues
Before you get started
Before starting this tutorial, make sure you have:
1. An active Embold account (Don’t have one? Check Sign up free here).
2. Gone through your First Scan and Identifying Problems. Improving Hotspots article builds off the lessons learned in these previous articles.
Analysing the component rating
In Identifying Problems, the selected component could be problematic and requires further investigation. Navigate to this component by selecting th
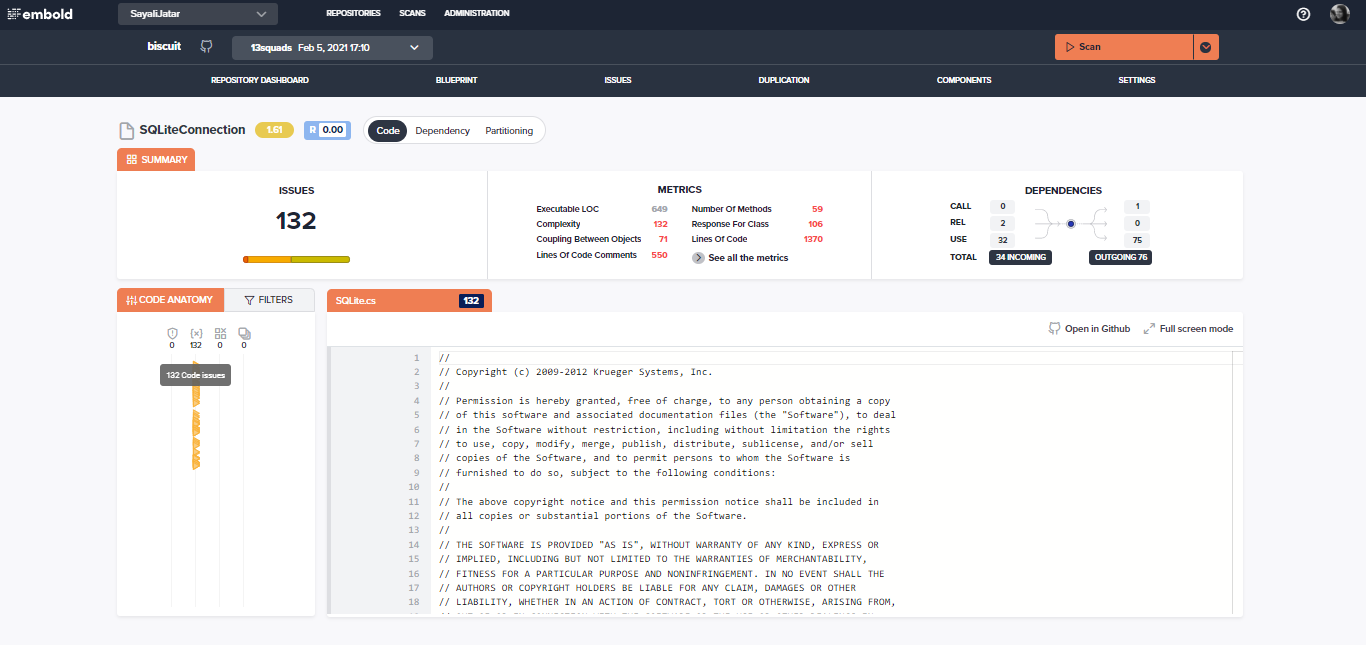
Besides the component name, the Embold overall rating along with the risk score scores is displayed at the top. Additional information is displayed when you hover over these ratings.
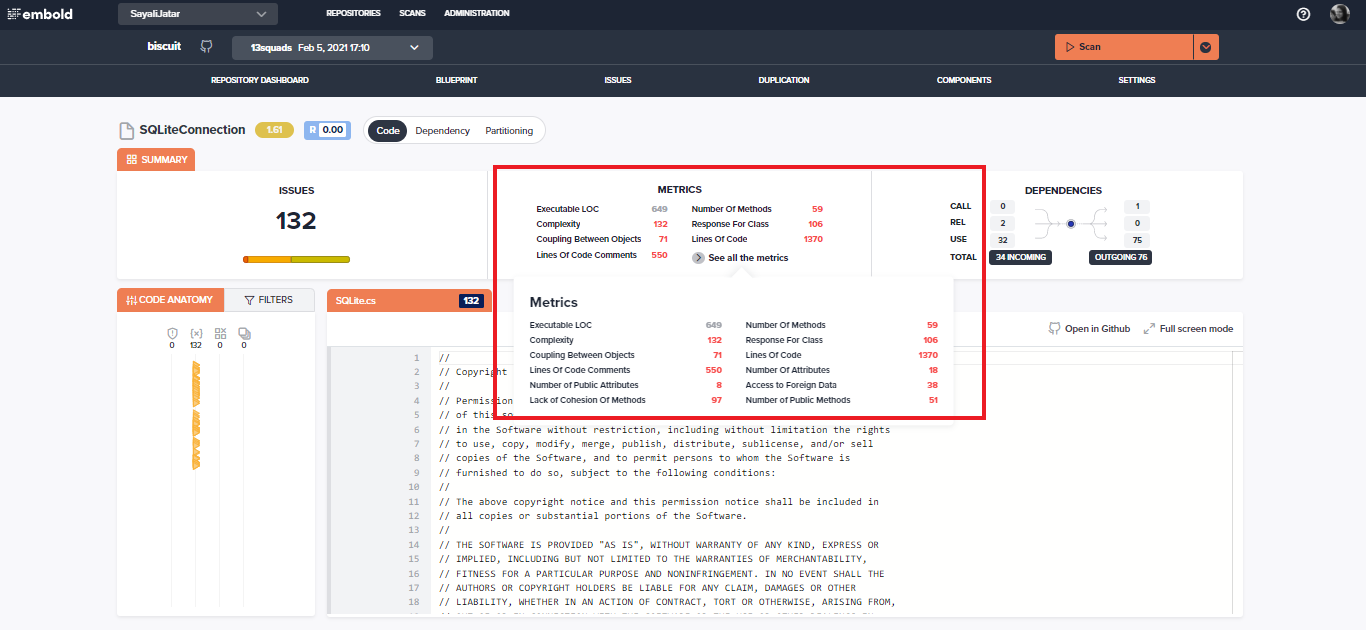
Hovering over the “See all the metrics” text opens up the actual metric values for this component. The red values indicate that a metric has exceeded our threshold and is thus considered sub-optimal. Find out more about our metrics and their thresholds on our documentation.
Investigating problematic areas of the code
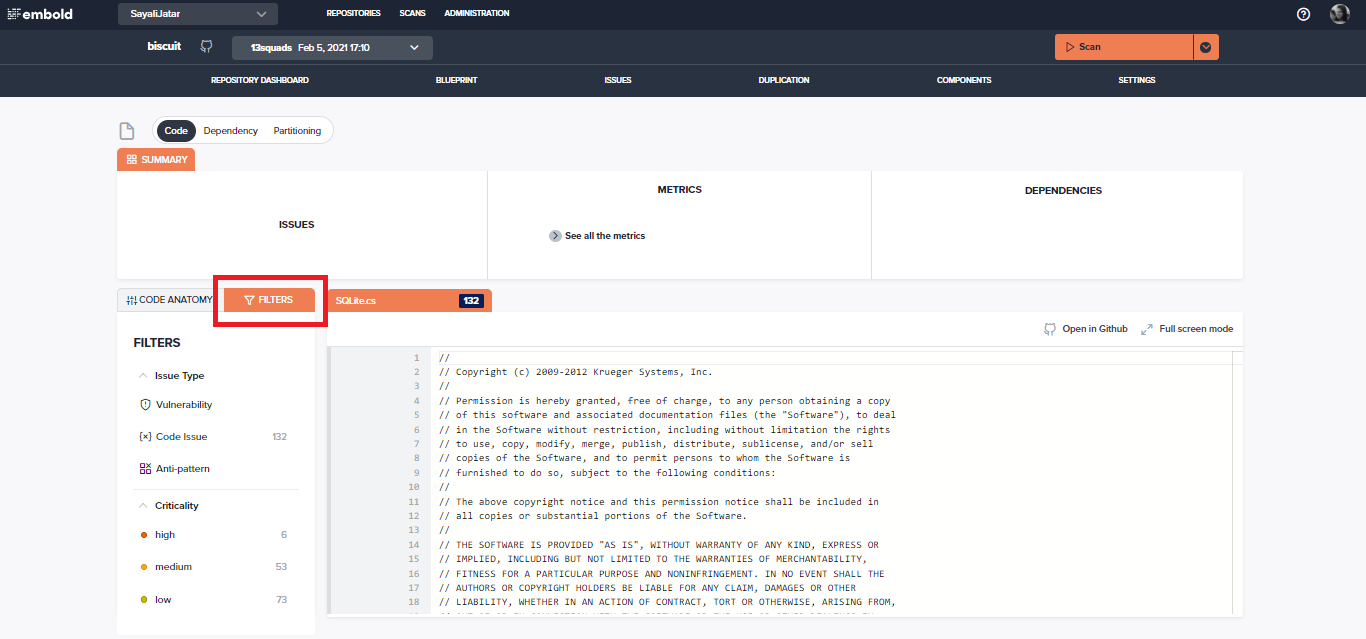
Below is a view of the source code for this specific component. The code itself is displayed on the right side, whereas all code specific findings are on the left side. There are different types of findings like:
1. Vulnerabilities
2. Code Issues
3. Anti-patterns
4. Duplication
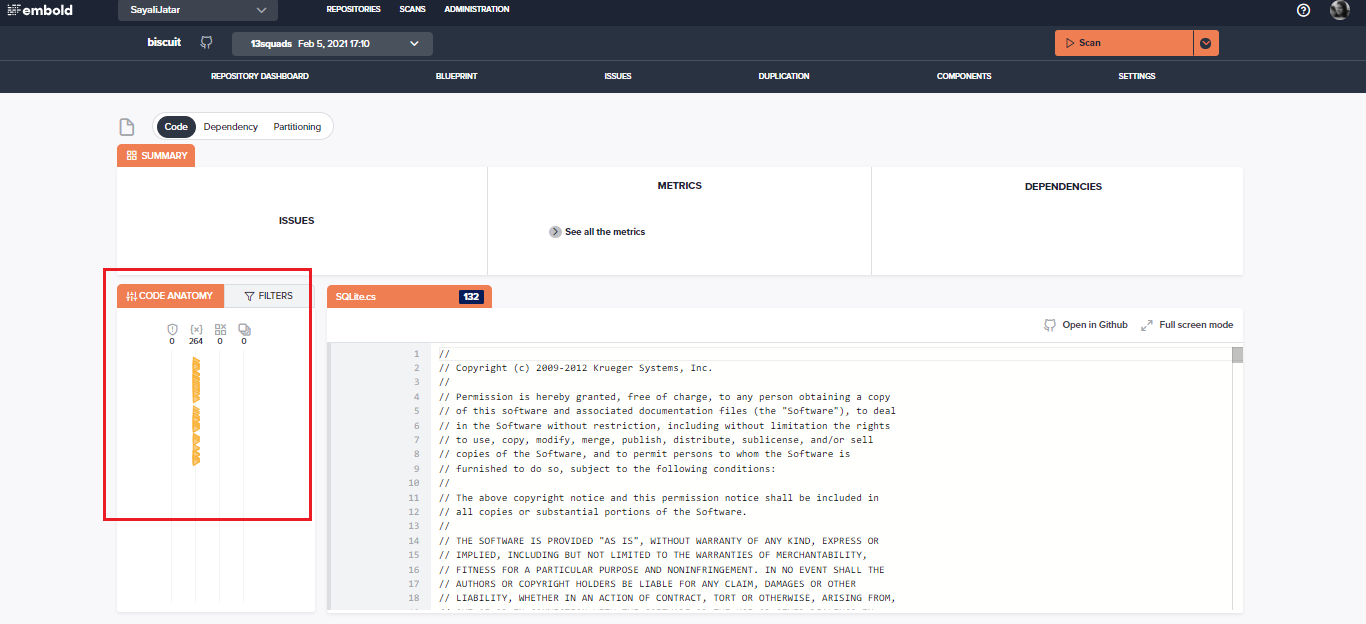
The line number is displayed on the left side when the user clicks under “Code Anatomy” for any of the types and hovers from top to bottom. He will be redirected to that specific line number on the code view right-side panel when he clicks on that section.
Next to the code anatomy tab, the “Filters” tab is displayed. Click on the Filters tab to check for more filtered information.
Analyse dependencies
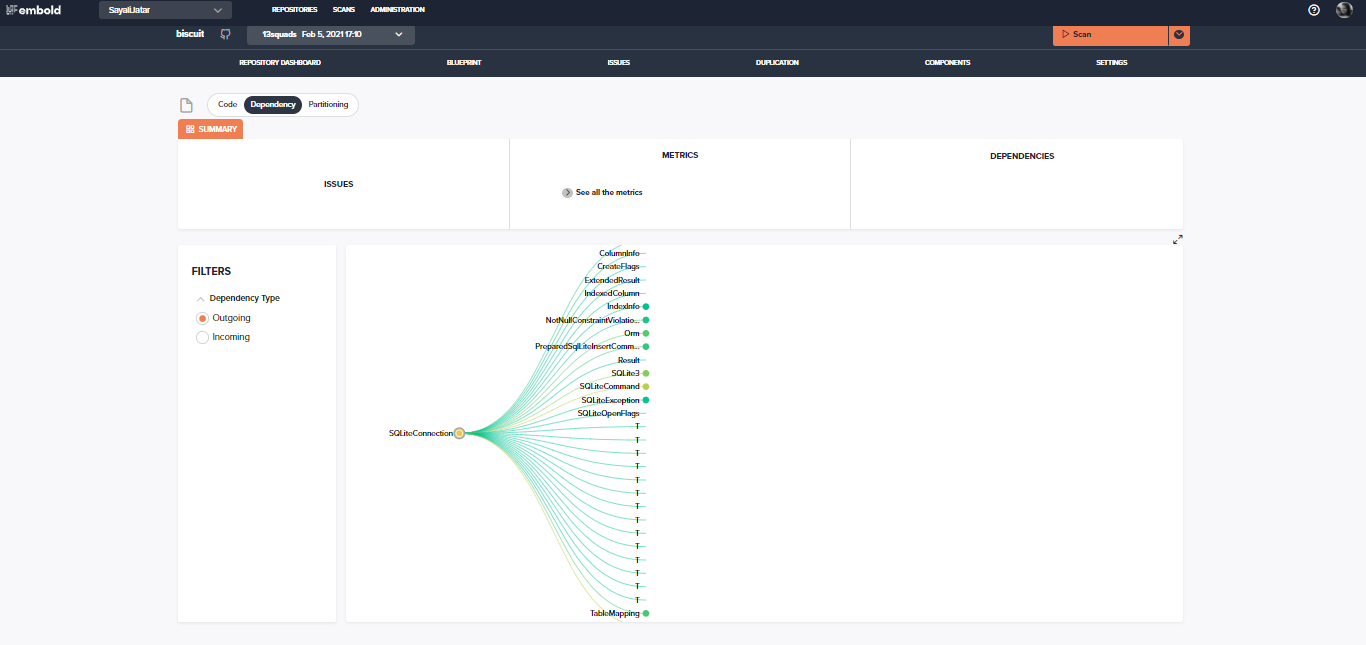
After navigating to the Component Explorer of a certain component, the Dependency View can be accessed by entering into that specific component:
The Dependency View can show all incoming or outgoing dependencies of one component. Outgoing dependencies are describing the components that are used by the current component, incoming dependencies show which other components use the current component. The colour of the connecting line between two components indicates the respective rating of a connected component.
To view multiple levels of dependencies, can click the little circles after each component name. This can especially be useful when analyzing a dependency-based anti-pattern such as Global/local Butterflies or global/local Breakables.
Using the Partitioning Editor
When to use the partitioning editor?
There are many issues that are a result of classes being too large. This can range from components that are slightly above the recommended lines of code threshold to large components with
A common strategy for dealing with such components is breaking them up into multiple smaller components. This way, each component is providing a clean abstraction and cohesive functionality. Unfortunately, doing this kind of refactoring can be quite complicated, especially when dealing with very large classes. The Partitioning Editor is intended to make this kind of refactoring work more efficient.
How to use the partitioning editor?
After navigating to the Component Explorer of a certain component, the Partitioning View can be accessed by entering into that specific component.
Based on a partitioning algorithm and language processing, it recommends a way to split up the current component into multiple smaller components. With the range input on the top, the granularity of the partitioning algorithm can be defined. The higher the range, the finer the recommended partitioning.
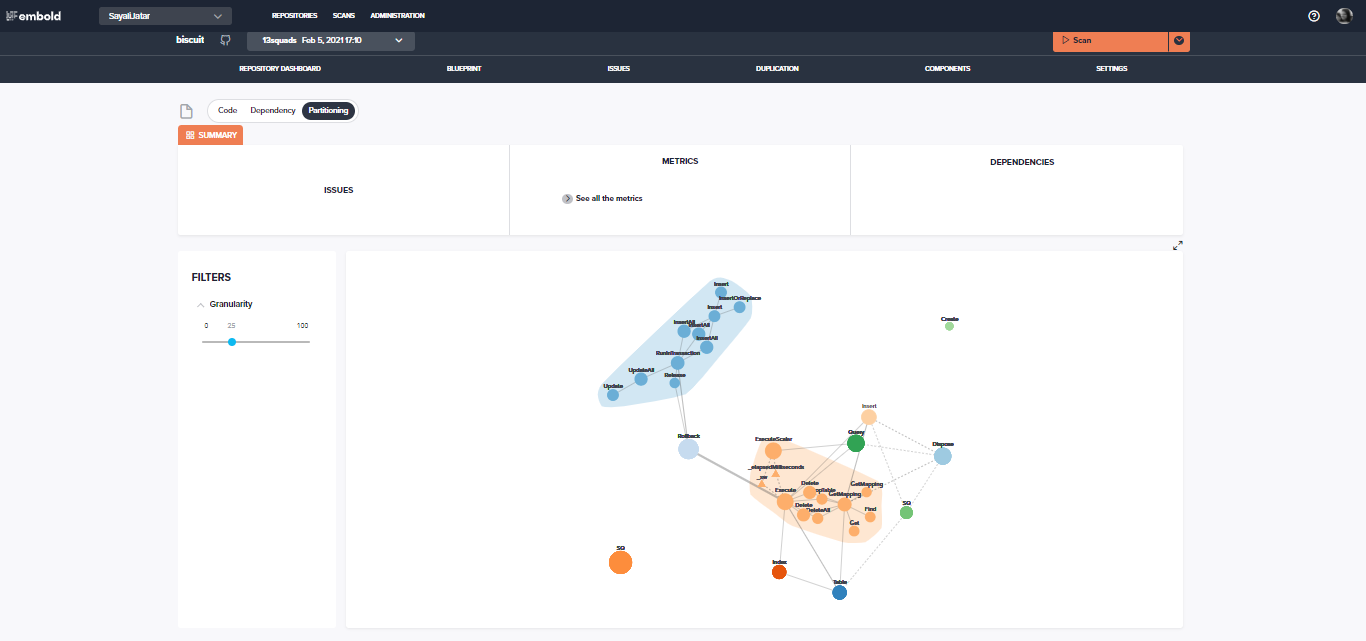
The screenshot above shows one sample partitioning. It shows that it is possible to split this component into smaller components as well as a few minor ones. When clicking on one of the bubbles, it shows which attributes and methods of the component are suggested to be put into that partition
Configuration using a Yaml file
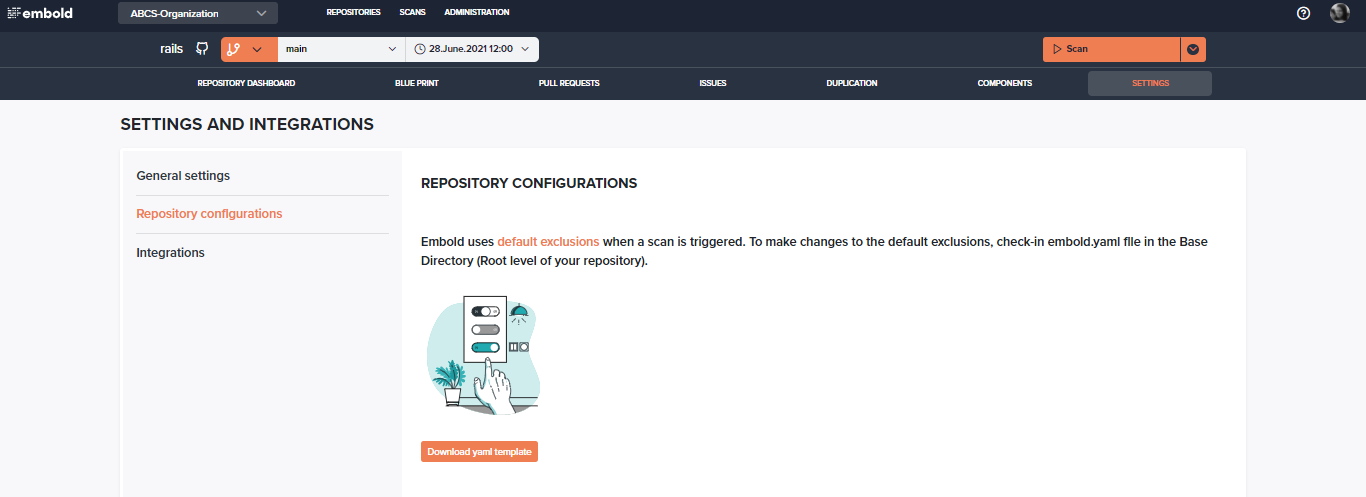
YAML is a human-readable programming language that helps to define workflow configuration. Embold uses a YAML file for storing the configuration.
YAML file has default configuration settings, but in case, if any user wants to make changes to the default configurations, make sure to check in the embold.yaml file in the repository.
This file needs to be checked into the Base Directory i.e. Root level.
Default Configurations
1. Exclusions
Embold uses below default exclusions while scanning your repositories:
version: 1
sources:
  #Files or Directories to be Excluded are mentioned in exclusions
  exclusions:
    - 'test'
    - 'generated'
    - 'mock'
    - 'thirdparty'
    - 'third-party'
    - '3rd-party'
    - '3rdparty'
    - 'external'
    - 'build'
    - 'node_modules'
    - 'assets'
    - 'gulp'
    - 'grunt'
    - 'library'
    - 'libs'
    - '.git'
2.Modules
Below is an example of a YAML file that contains modules and rules.
# modules:
    - name: gamma_java
      enabled: true
      rules:
         - key: 'EMB-JAVA-10'
           enabled: false
    - name: pmd
      enabled: true
3. Languages
When you scan your repository, Embold automatically detects languages that are in your repository. If the language key is not present it identifies all the languages and runs the scan for the same.
Supported languages are:
JAVA, CPP, C_SHARP, PYTHON, JAVASCRIPT, TYPESCRIPT, GO, OBJECTIVE_C, KOTLIN, PHP, SOLIDITY, SQL, SWIFT, RUBY, APEX, HTML, CSS
Update Configurations
1. Exclusions
Embold uses default exclusions when a scan is triggered. But in case, you want to make changes to the default exclusions, you can check in embold.yaml file in the Base Directory (Root level of your repository).
Embold uses the YAML file format for configurations.
Embold supports exclusions using Regex patterns.
Example: Below is the regular expression “*(?i)(test|generated|mock|thirdparty|third-party|3rd-party|3rdparty|external)*“
Please note that:
- If embold.yaml file is not checked in in your repository, default exclusions will be considered.
Default exclusions:
sources:
  #Files or Directories to be Excluded are mentioned in exclusions
  exclusions:
    - 'test'
    - 'generated'
    - 'mock'
    - 'thirdparty'
    - 'third-party'
    - '3rd-party'
    - '3rdparty'
    - 'external'
    - 'build'
    - 'node_modules'
    - 'assets'
    - 'gulp'
    - 'grunt'
    - 'library'
    - 'libs'
    - '.git'
    - 'demosubproject'
- If the embold.yaml file is checked in, but exclusions are not defined, no files will be excluded while scanning.
sources:
exclusions:- If the embold.yaml file is checked in, exclusions are defined, then exclusions from the checked in file will be considered while scanning. These will affect the executable lines of code in the source code.
sources:
#Files or Directories to be Excluded are mentioned in exclusions
exclusions:
- 'test'
- 'generated'- In the above example, all files/folders containing test or mock will be excluded.
2. Languages
All languages are detected by default by Embold. If you do not wish to scan all languages from your repository, you can update the embold.yaml file as shown below.
#languages: 'JAVA,CPP'3. Modules
How to update modules?
To disable any specific module, use below syntax. List of all modules for a specific language is given in the table below.
#modules:
#  - name: pmd
#    enabled: true
You can check the module name for a particular rule on https://rules.embold.io/
Below table shows a list of all languages and modules supported by Embold.
| Sr no. | Languages | Modules | Default Enabled | Type |
|---|---|---|---|---|
| 1 | Java | pmd | Enabled | Code Issues |
| gamma_java | Enabled | Code Issues | ||
| spotbugs | Disabled | Code Issues | ||
| klocwork | Disabled | Code Issues | ||
| findsecbugs | Disabled | Code Issues | ||
| clover | Enabled | Coverage | ||
| jacoco | Enabled | Coverage | ||
| 2 | CPP | klocwork | Disabled | Code Issues |
| cpplint | Disabled | Code Issues | ||
| cppcheck | Enabled | Code Issues | ||
| embold_sec | Disabled | Code Issues | ||
| gtest | Enabled | Unit Test | ||
| gcov | Enabled | Coverage | ||
| 3 | C_SHARP | gamma_cs | Enabled | Code Issues |
| mstest | Enabled | Unit Test | ||
| coverlet | Enabled | Coverage | ||
| 4 | Apex | pmd | Enabled | Code Issues |
| 5 | Objective_C | gamma_cxx | Enabled | Code Issues |
| 6 | PHP | embold_s ec | Disabled | Code Issues |
| phpmd | Enabled | Code Issues | ||
| phpcs | Enabled | Code Issues | ||
| 7 | Python | pylint | Enabled | Code Issues |
| dlint | Enabled | Code Issues | ||
| bandit | Enabled | Code Issues | ||
| 8 | JavaScript | eslint | Enabled | Code Issues |
| gamma_js | Enabled | Code Issues | ||
| jshint | Disabled | Code Issues | ||
| 9 | TypeScript | tslint | Enabled | Code Issues |
| 10 | GO | gometalinter | Enabled | Code Issues |
| gosec | Enabled | Code Issues | ||
| staticcheck | Enabled | Code Issues | ||
| 11 | Kotlin | detekt | Enabled | Code Issues |
| 12 | Solidity | solium | Enabled | Code Issues |
| 13 | SQL | sqlcheck | Enabled | Code Issues |
| 14 | Swift | swiftlint | Enabled | Code Issues |
| 15 | Ruby | brakeman | Enabled | Code Issues |
| 16 | HTML | htmlhint | Enabled | Code Issues |
| 17 | CSS | stylelint | Enabled | Code Issues |
| 18 | ALL | sonar | Disabled | Code Issues |
| gamma_generic | Disabled | Code Issues | ||
| relevance | Enabled | Relevance |
4. Rules
To disable any specific rule, use below syntax. Add the list of rules inside a module it belongs to. List of all rules for a specific language can be found here.
modules:
    - name: gamma_java
      enabled: true
      rules:
         - key: 'EMB-JAVA-10'
           enabled: false
- Module name in which the rule belongs can be found under Module Name and “key” under Issue Key on the Rules page. Page also shows if the rules is enabled or disabled by default.

4. Custom Configurations
Python: Pylint specific configurations:
- To enable Pylint specific configurations, add
pylintrcor.pylintrc fileinbaseDir at root level of your repository. - If your Pylint configuration file(pylintrc or .pylintrc) is present in some other directory, you can mention custom file path in embold.yaml.
Eg.
modules:
- name: pylint
       enabled: true
       config:
         - name: config
            type: text
            required: true
            value: Abc/inference/pylintrc
- config file path is given in embold.yaml file (absolute / relative to baseDir)
- If configuration file is not present in baseDir OR if the custom file path is not mentioned in embold.yaml (pylintrc or .pylintrc, all default rules supported by pylint are enabled
Steps to download a YAML file from Embold
- Select any repository.
- Either click on three dots (…) on the right side corner of your repository or on the Repository Dashboard page, click on the “Settings” tab.
- On the “Settings and Integration” page, navigate to the “Repository Configurations” section.
- Download the YAML template. Rename the file name with embold.yaml.
