Before you get started
Before starting this tutorial, make sure you have:
1. An active Embold account (Don’t have one? Check Sign up free here).
2. Gone through your First Scan and Identifying Problems. Improving Hotspots article builds off the lessons learned in these previous articles.
Analysing the component rating
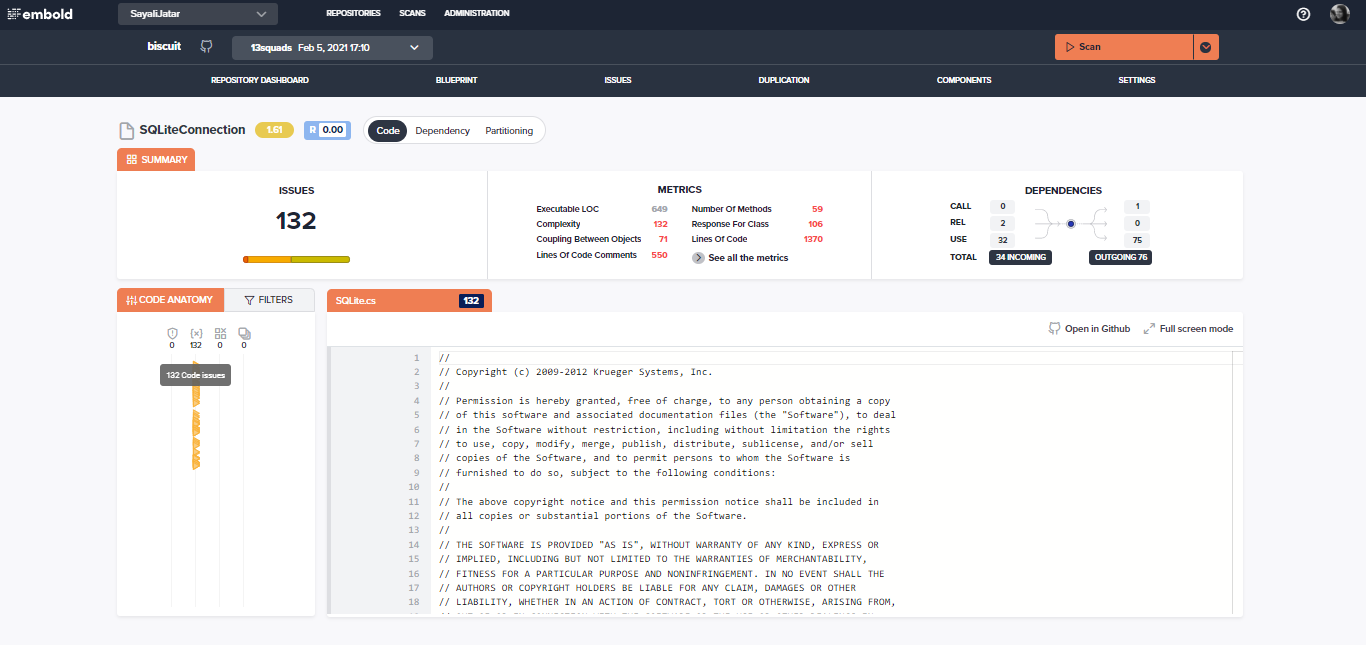
In Identifying Problems, the selected component could be problematic and requires further investigation. Navigate to this component by selecting th

Besides the component name, the Embold overall rating along with the risk score scores is displayed at the top. Additional information is displayed when you hover over these ratings.
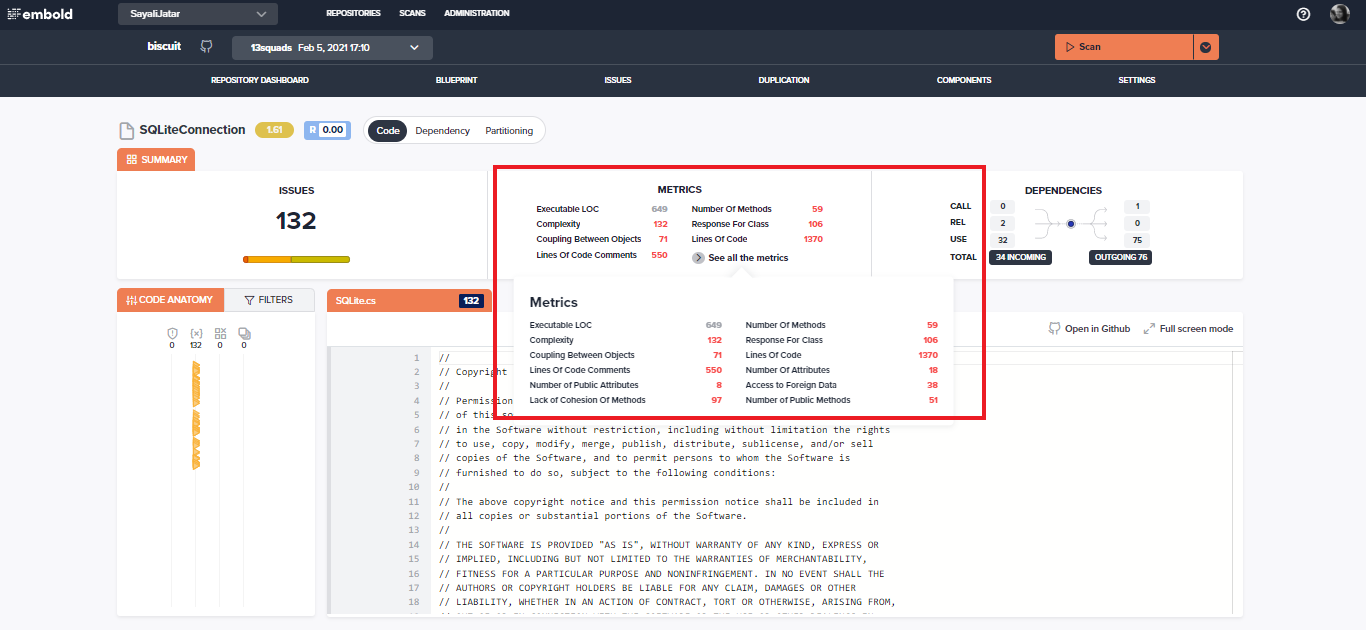
Hovering over the “See all the metrics” text opens up the actual metric values for this component. The red values indicate that a metric has exceeded our threshold and is thus considered sub-optimal. Find out more about our metrics and their thresholds on our documentation.

Investigating problematic areas of the code
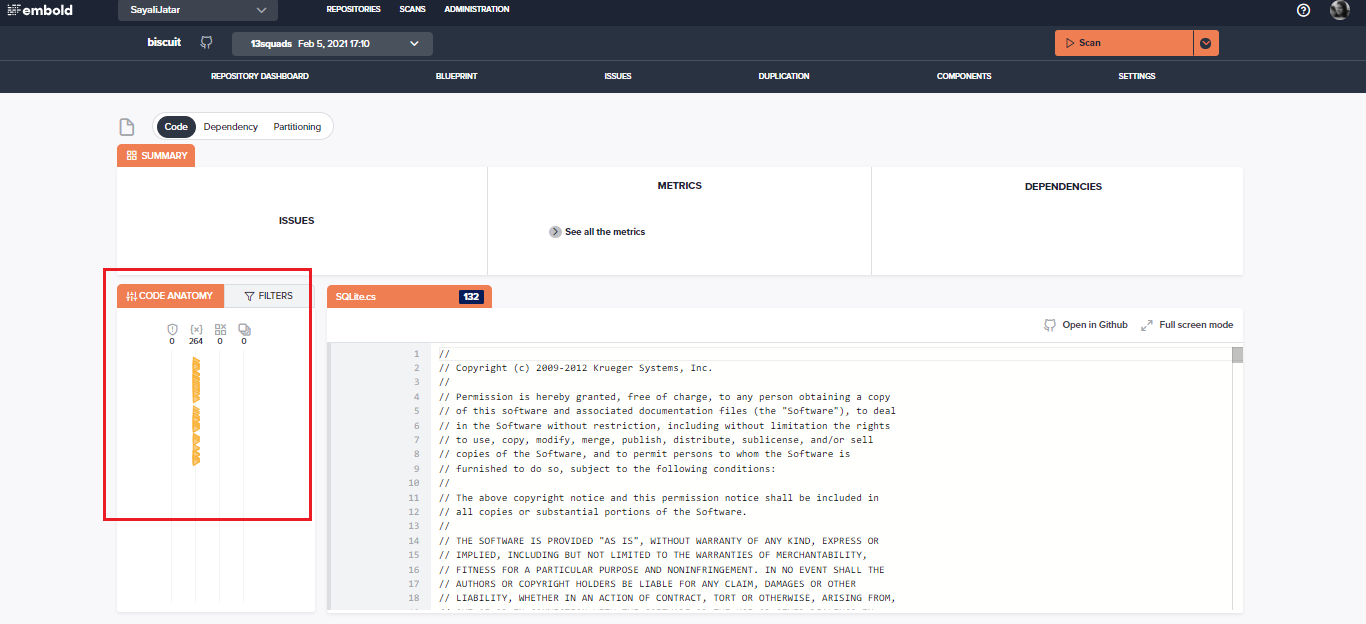
Below is a view of the source code for this specific component. The code itself is displayed on the right side, whereas all code specific findings are on the left side. There are different types of findings like:
1. Vulnerabilities
2. Code Issues
3. Anti-patterns
4. Duplication

The line number is displayed on the left side when the user clicks under “Code Anatomy” for any of the types and hovers from top to bottom. He will be redirected to that specific line number on the code view right-side panel when he clicks on that section.
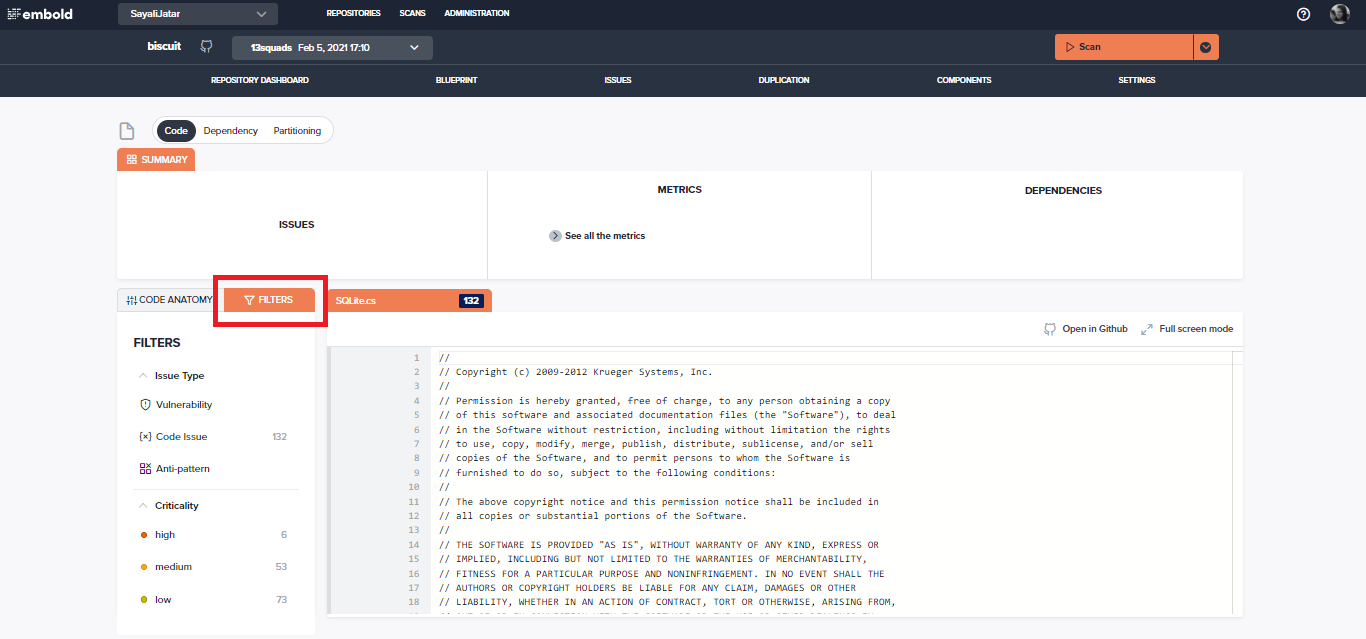
Next to the code anatomy tab, the “Filters” tab is displayed. Click on the Filters tab to check for more filtered information.

