What Does the Heatmap Show?
The Heatmap can be accessed from the top navigation bar by clicking the box icon next to the fire icon:

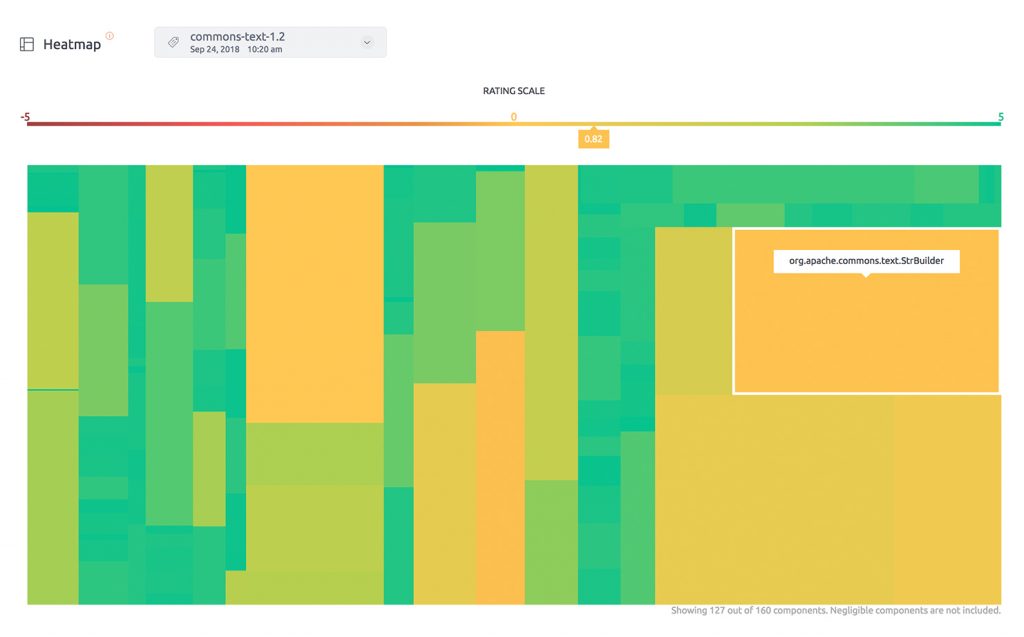
Clicking on it will bring you to the Heatmap page, which shows the main components of your repository. Each component is represented as a rectangle, where the size of the rectangle stands for the size (lines of code) of this component, and the color represents the rating. By hovering over the rectangles with your mouse, the name of the component is shown, as well as its rating on the rating scale.

Use of Heatmap
The heatmap can be used for two things:
1. Understanding the overall quality of your software.
2. Identifying components to investigate further
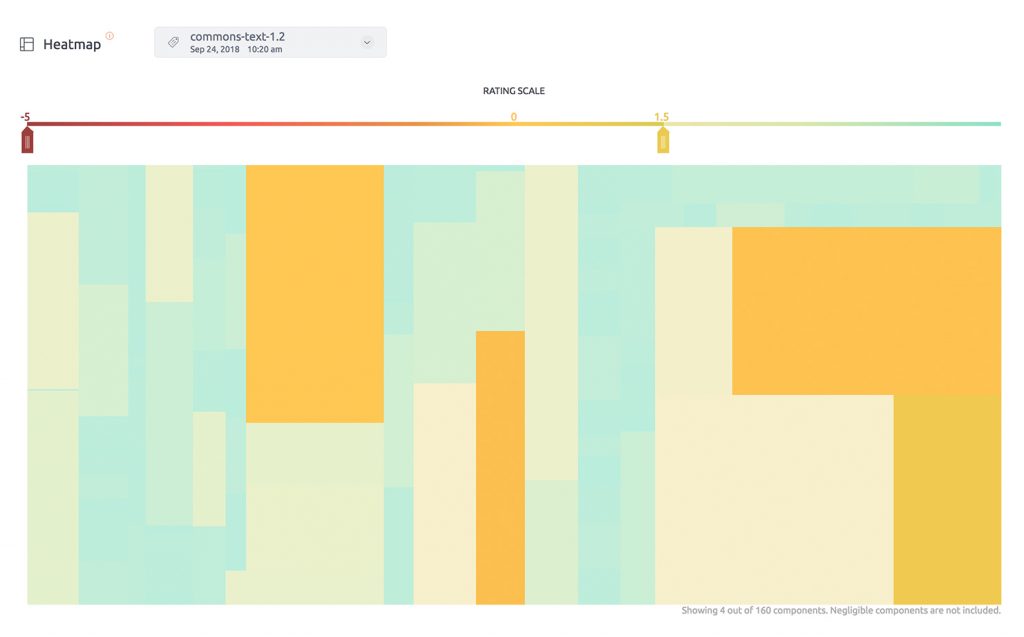
The slider at the top of the Heatmap can be used to highlight the specific components that fall under the different ratings. For example, it can be used to highlight all components with a rating lower than 1.5.

The large orange components are indicative
To learn how you can use the Component Explorer to improve the score, have a look at Improving Hotspots.
