Set up your remote Embold instance. This is where your analysis results will be published. Follow the steps to set up remote analysis here.
- Follow the steps to set up remote scan
- If you wish to create a separate build folder for running trace-utility (intercept-build), you should use the –cdb additional option while running the scan.
The compile_commands.json will be created inside your build directory and not in the base directory of your source folder. Since, the scanner looks for the compile_commands.json in the base directory by default, use the –cdb option to specify the directory where your compile_commands.json is located. - In “settings” section, under “additionalOptions” set the directory where compilation database resides.
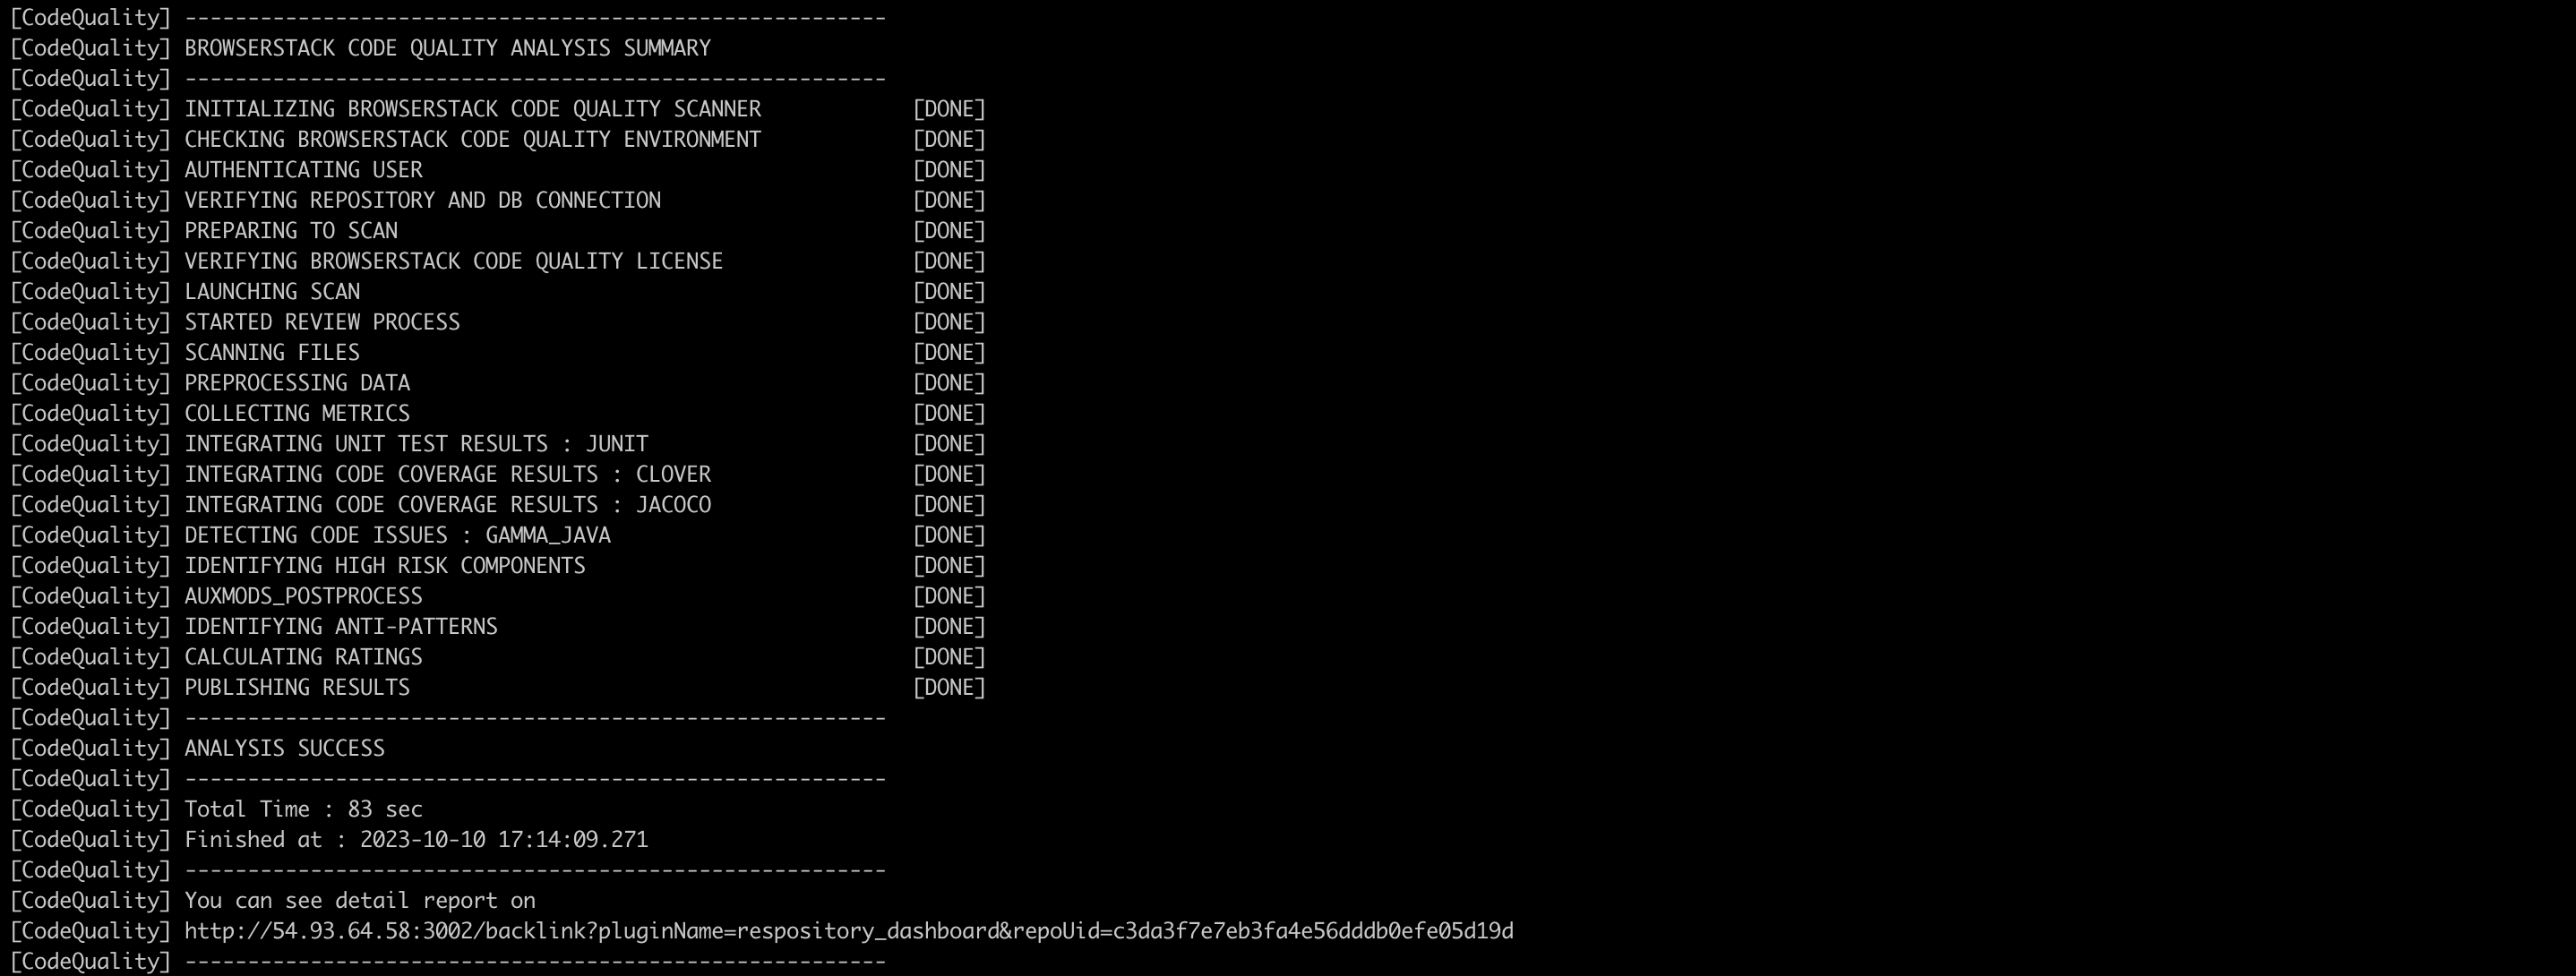
Example: –cdb= - If the scan is successful you should see “ANALYSIS SUCCESS”. On your build machine, the last two log messages indicate that the remote analysis was successful.
- On your remote Embold instance, you will be able to see published results.

