What does the component list show?
The component list can be accessed from the Node Summary bar by clicking on the list icon:

You will be redirected to a page that shows a list of all components of your software sorted by ascending Overall Score. The components with the worst score are at the top. Next to the overall score, the sub-ratings for Design, Metrics, Duplication and Code Issues are shown.

The list can be sorted by any of these ratings to allow you to find the top issues depending on which category you want to improve first, such as design quality.

How to use the component list?
In our example with Apache Common-Text, the three worst components by overall rating are StrSubstitutor, StrBuilder and StrBuilderAppendInsertTest. Since the third component represents software tests, it would be better to focus on the other two. In order to get into the code level, click on the component name and it will redirect you to the Component Explorer.

When you sort by design rating, there are two other components that have the worst rating and will be at the top of the list.
How to assess the risk?
The Embold Risk rating is displayed in the first column, next to the component name. While the Overall Rating represents the software quality of one component, the Risk rating is about how much impact this component would have on your software should something go wrong. For some projects, it is acceptable for a component to have a low Overall Rating if the risk related to it is low. But if a component has a high risk rating with a low Overall Score, it should be dealt with quickly.
All in all, the component StrSubstitutor seems to be the component that needs most attention. It has the lowest overall Embold Score, the second lowest design score, an above average risk and is not a testing component. To find out how Embold helps to improve components, have a look at your Improving Hotspots.
More advanced features
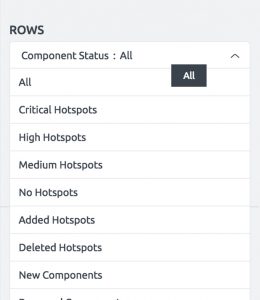
The parameter menu on the right side the Component List can be used for more advanced features. You can filter the displayed rows by their Hotspot status, or by various component types.
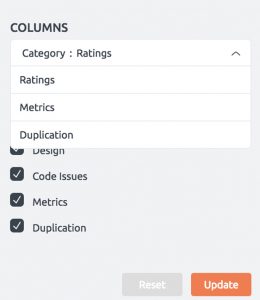
The Component List can also be used to display more information than just the ratings: it can display all calculated metrics and the duplication details as well. This can be selected from the Columns drop-down menu on the right side. You can view more information on the metrics here.