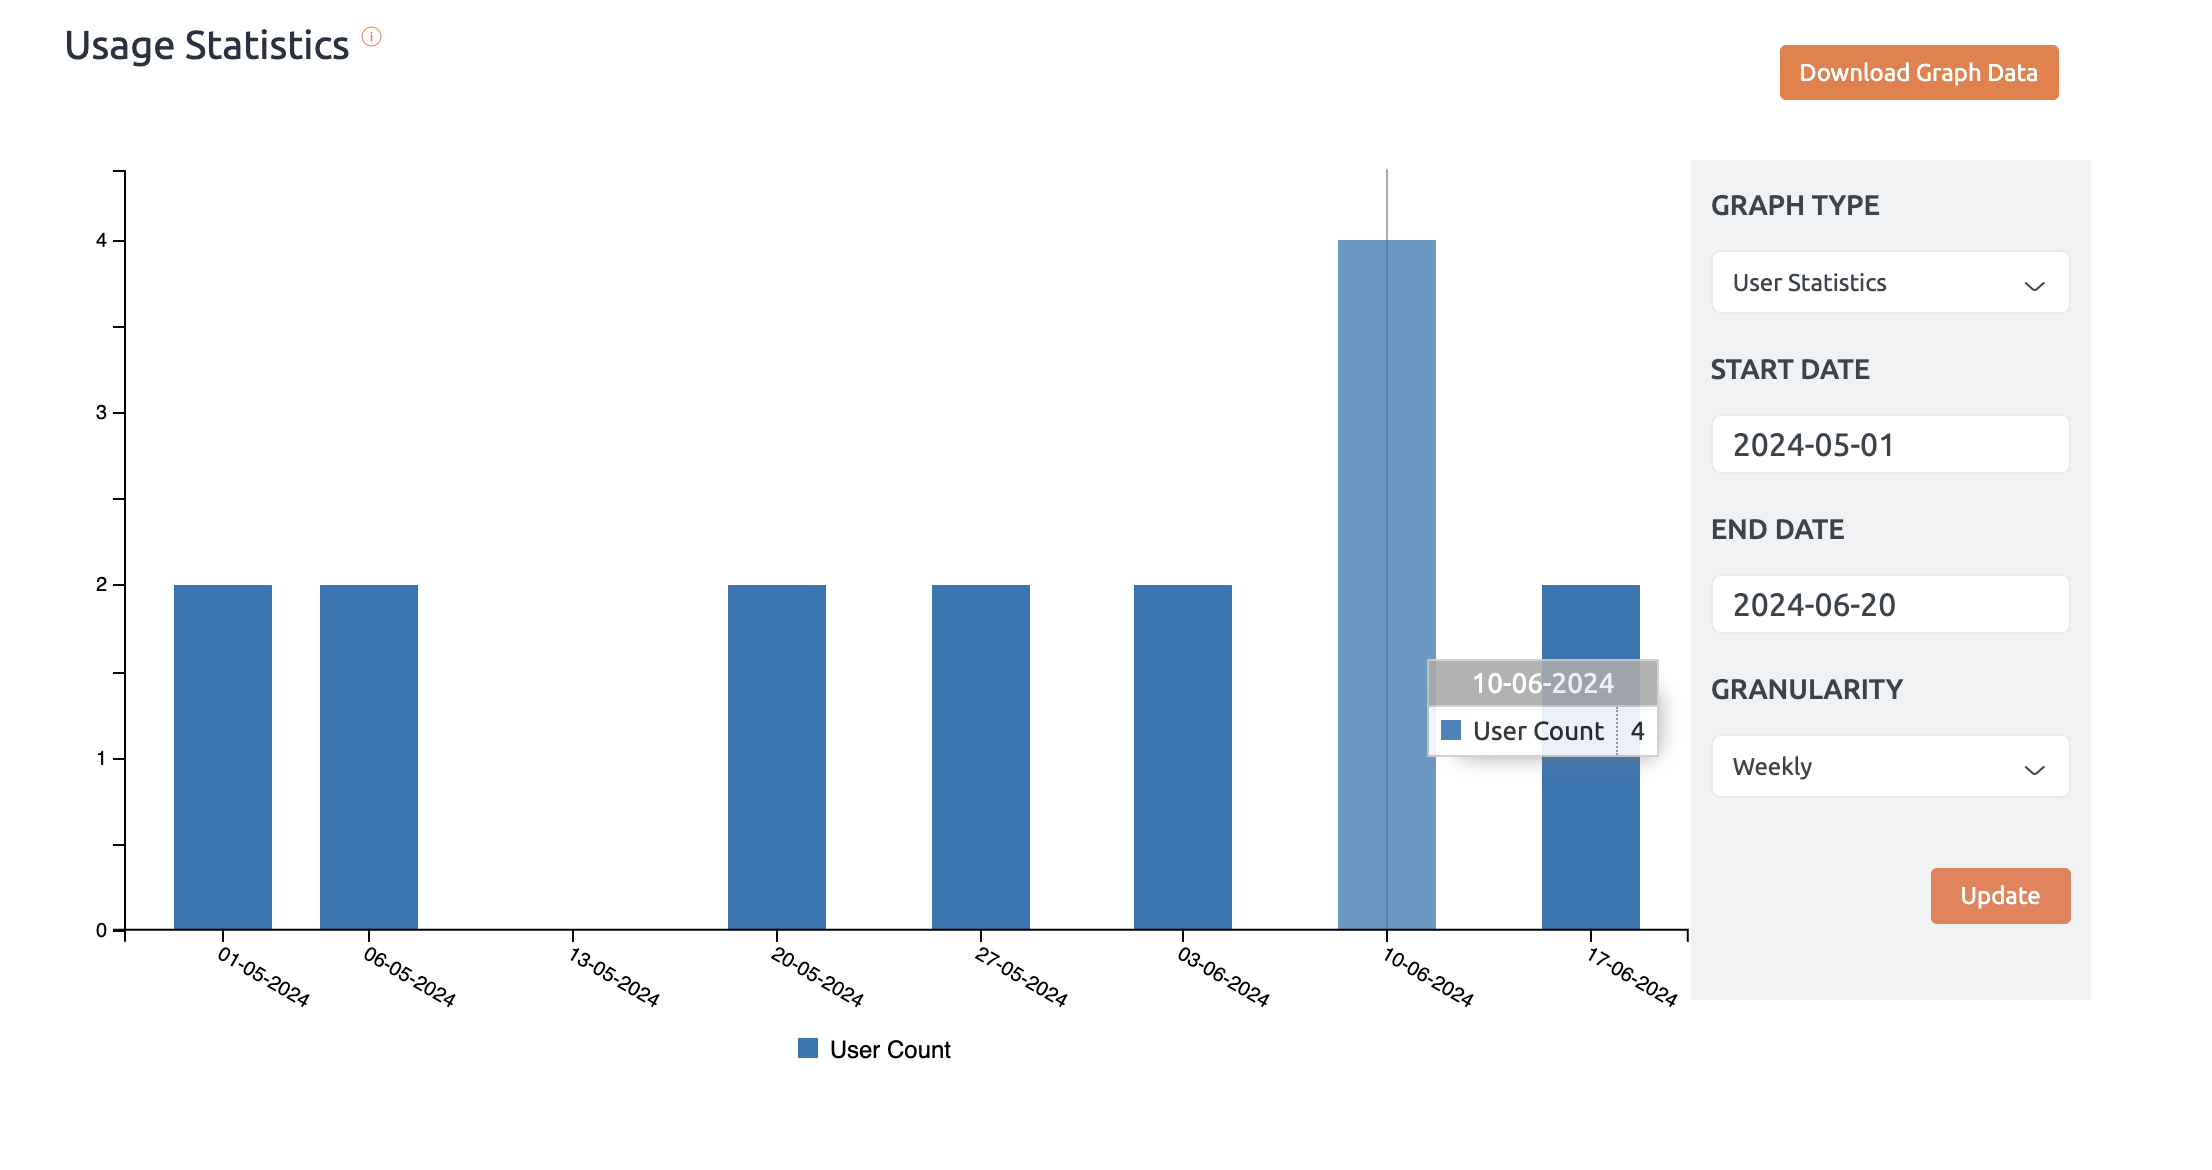
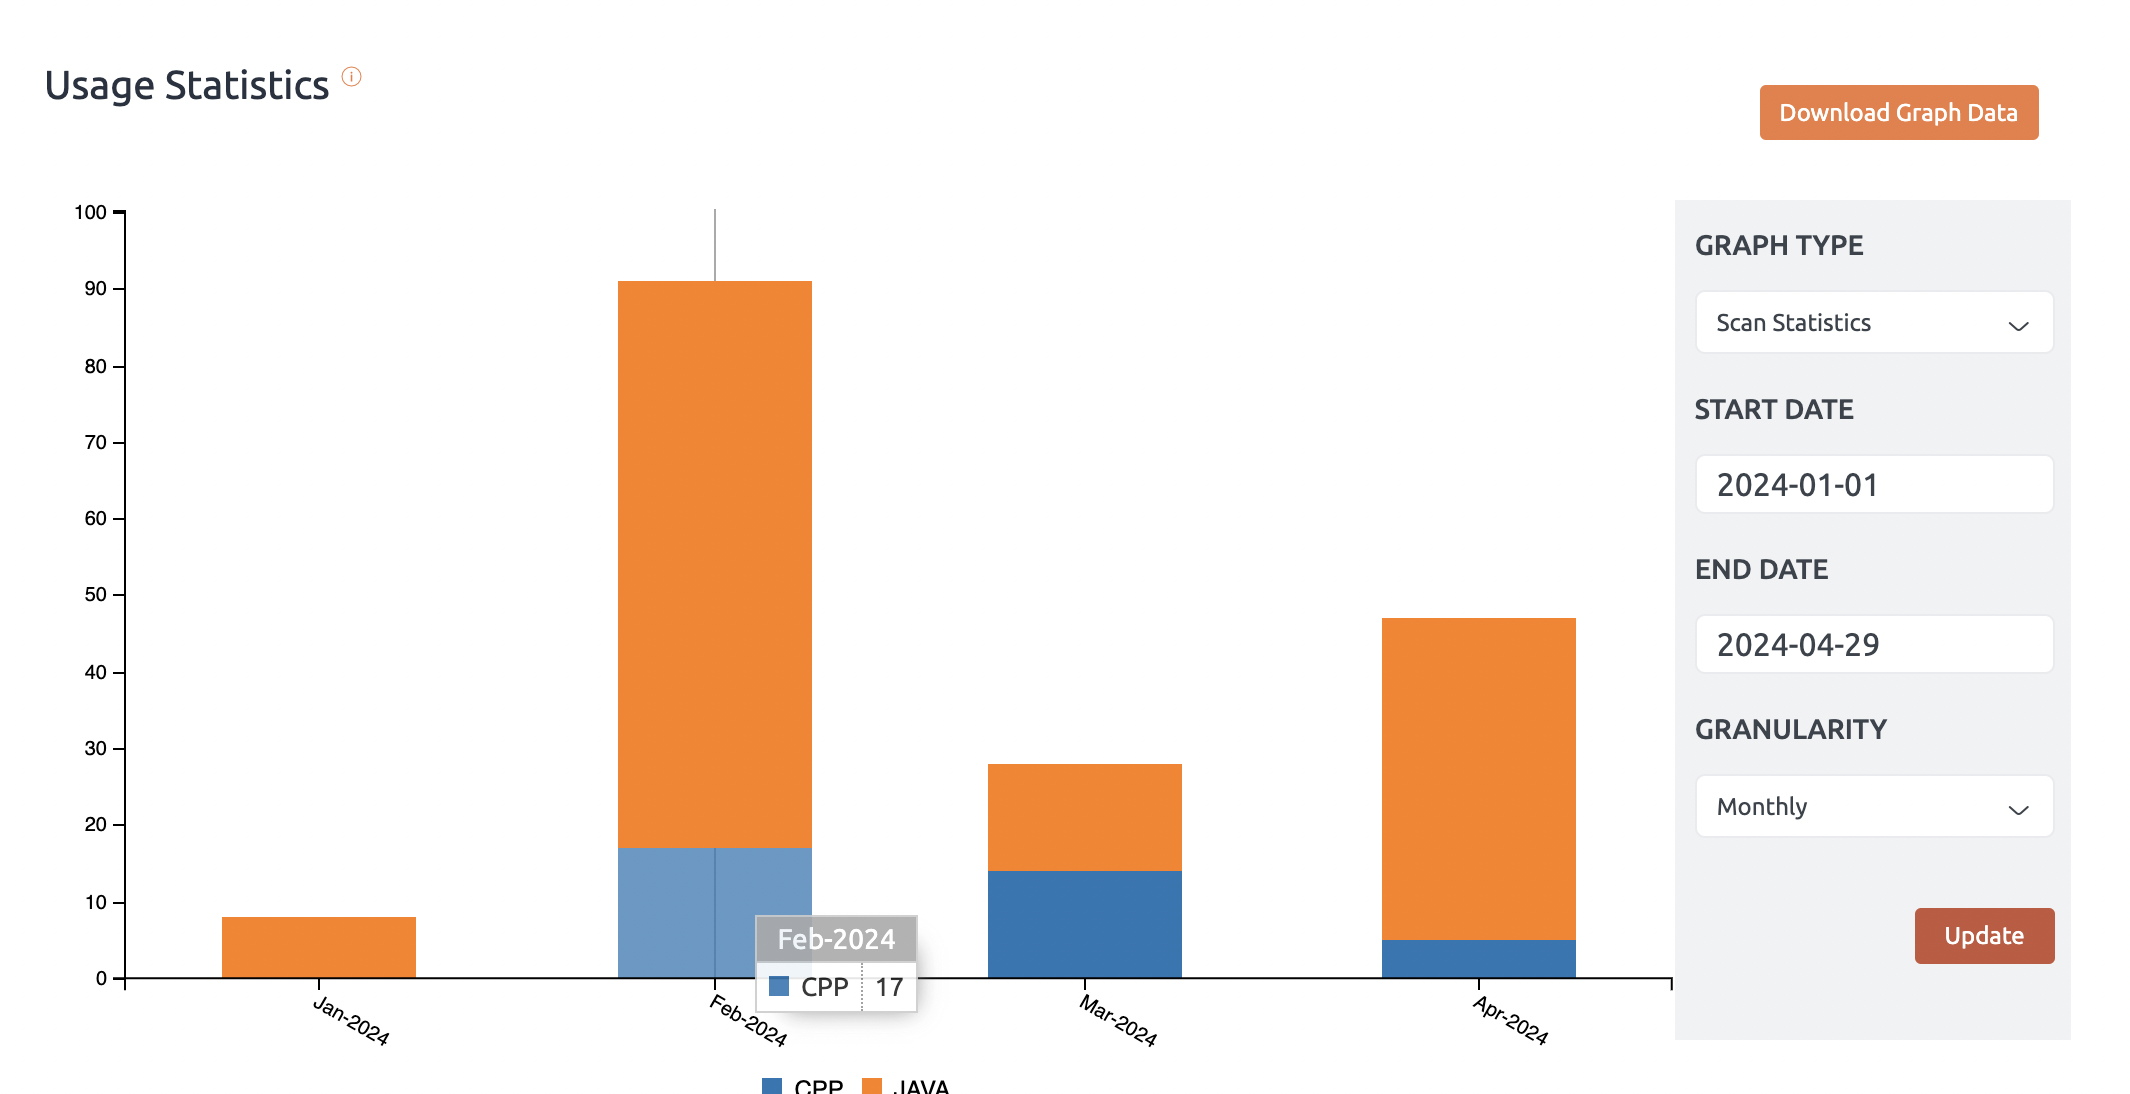
The “Usage Statistics” feature is a powerful tool designed to provide users with detailed insights into platform activity and utilization. It presents a graphical representation of key metrics such as user activity, feature usage, and scan operations, enabling users to monitor how the platform is being engaged over time.
Key Features:
- Customizable Date Range:
Users can specify a date range to focus on a particular period, making it easy to analyze trends over days, weeks, or months. - Granularity Options:
The data can be broken down by daily, weekly, or monthly intervals, offering flexibility to view high-level summaries or detailed activity logs. - Visual Representation:
Clear, intuitive graphs and charts make it simple to understand usage patterns at a glance, highlighting key areas of engagement and identifying potential areas for improvement. - Comprehensive Metrics:
Track metrics such as the number of active users, frequency of feature utilization, and scan operations performed. This ensures a holistic understanding of platform behavior. - Actionable Insights:
By analyzing the usage patterns, users can make informed decisions to optimize workflows, improve resource allocation, or enhance feature adoption.
This feature is invaluable for administrators and stakeholders aiming to maximize the efficiency and effectiveness of the platform while identifying opportunities for growth and enhancement.
Feature statistics

User statistics

Scan statistics

